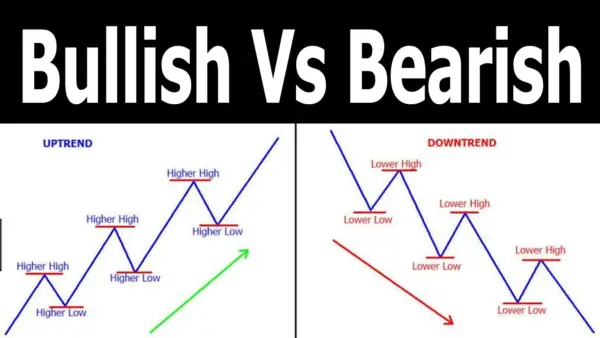
A bearish channel is a continuation chart pattern characterized by two parallel lines: a resistance line and a support line. The price moves between these lines, with the upper line acting as resistance and the lower line as support. In a bearish channel, the price trend is downward, and traders typically focus on short positions when the price rebounds after hitting the resistance line.
It is essential to avoid opening long positions near the support line in a bearish channel. The pattern is considered valid when the price touches the support line at least three times and the resistance line twice. Bearish channels are common in technical analysis and traders often look for short opportunities when prices approach the resistance line.
what are some common indicators used to identify a bearish channel
Common indicators used to identify a bearish channel include the Donchian Channel and Bollinger Bands. These indicators are part of envelope channels, which consider longer-term price movements. The Donchian Channel uses high and low prices to draw trendlines, with the resistance line based on the security’s high over a specified period and the support line based on the low over a predetermined period.
On the other hand, Bollinger Bands incorporate moving average trendlines, where the resistance trendline is two standard deviations above the moving average and the support trendline is two standard deviations below it. Traders often use these indicators within a bearish channel to assess price movements and make informed trading decisions.
what is the difference between a bearish channel and a bearish trend
A bearish channel and a bearish trend are related but distinct concepts in technical analysis.
- Bearish Channel: A bearish channel is a specific chart pattern characterized by two parallel lines – a resistance line and a support line. The price moves between these lines, with the upper line acting as resistance and the lower line as support. Traders focus on short positions when the price rebounds after hitting the resistance line. The pattern is considered valid when the price touches the support line at least three times and the resistance line twice. It is not advisable to open long positions near the support line in a bearish channel125.
- Bearish Trend: On the other hand, a bearish trend refers to a broader market movement where prices are consistently falling over an extended period. In a bearish trend, the overall direction of prices is downward, indicating a negative sentiment in the market. This trend is not confined to specific chart patterns like a bearish channel but reflects a general decline in prices over time.
In summary, a bearish channel is a specific chart pattern within a bearish trend. The bearish channel represents a more localized pattern of price movement within the broader context of a bearish trend, which signifies a sustained downward movement in prices.