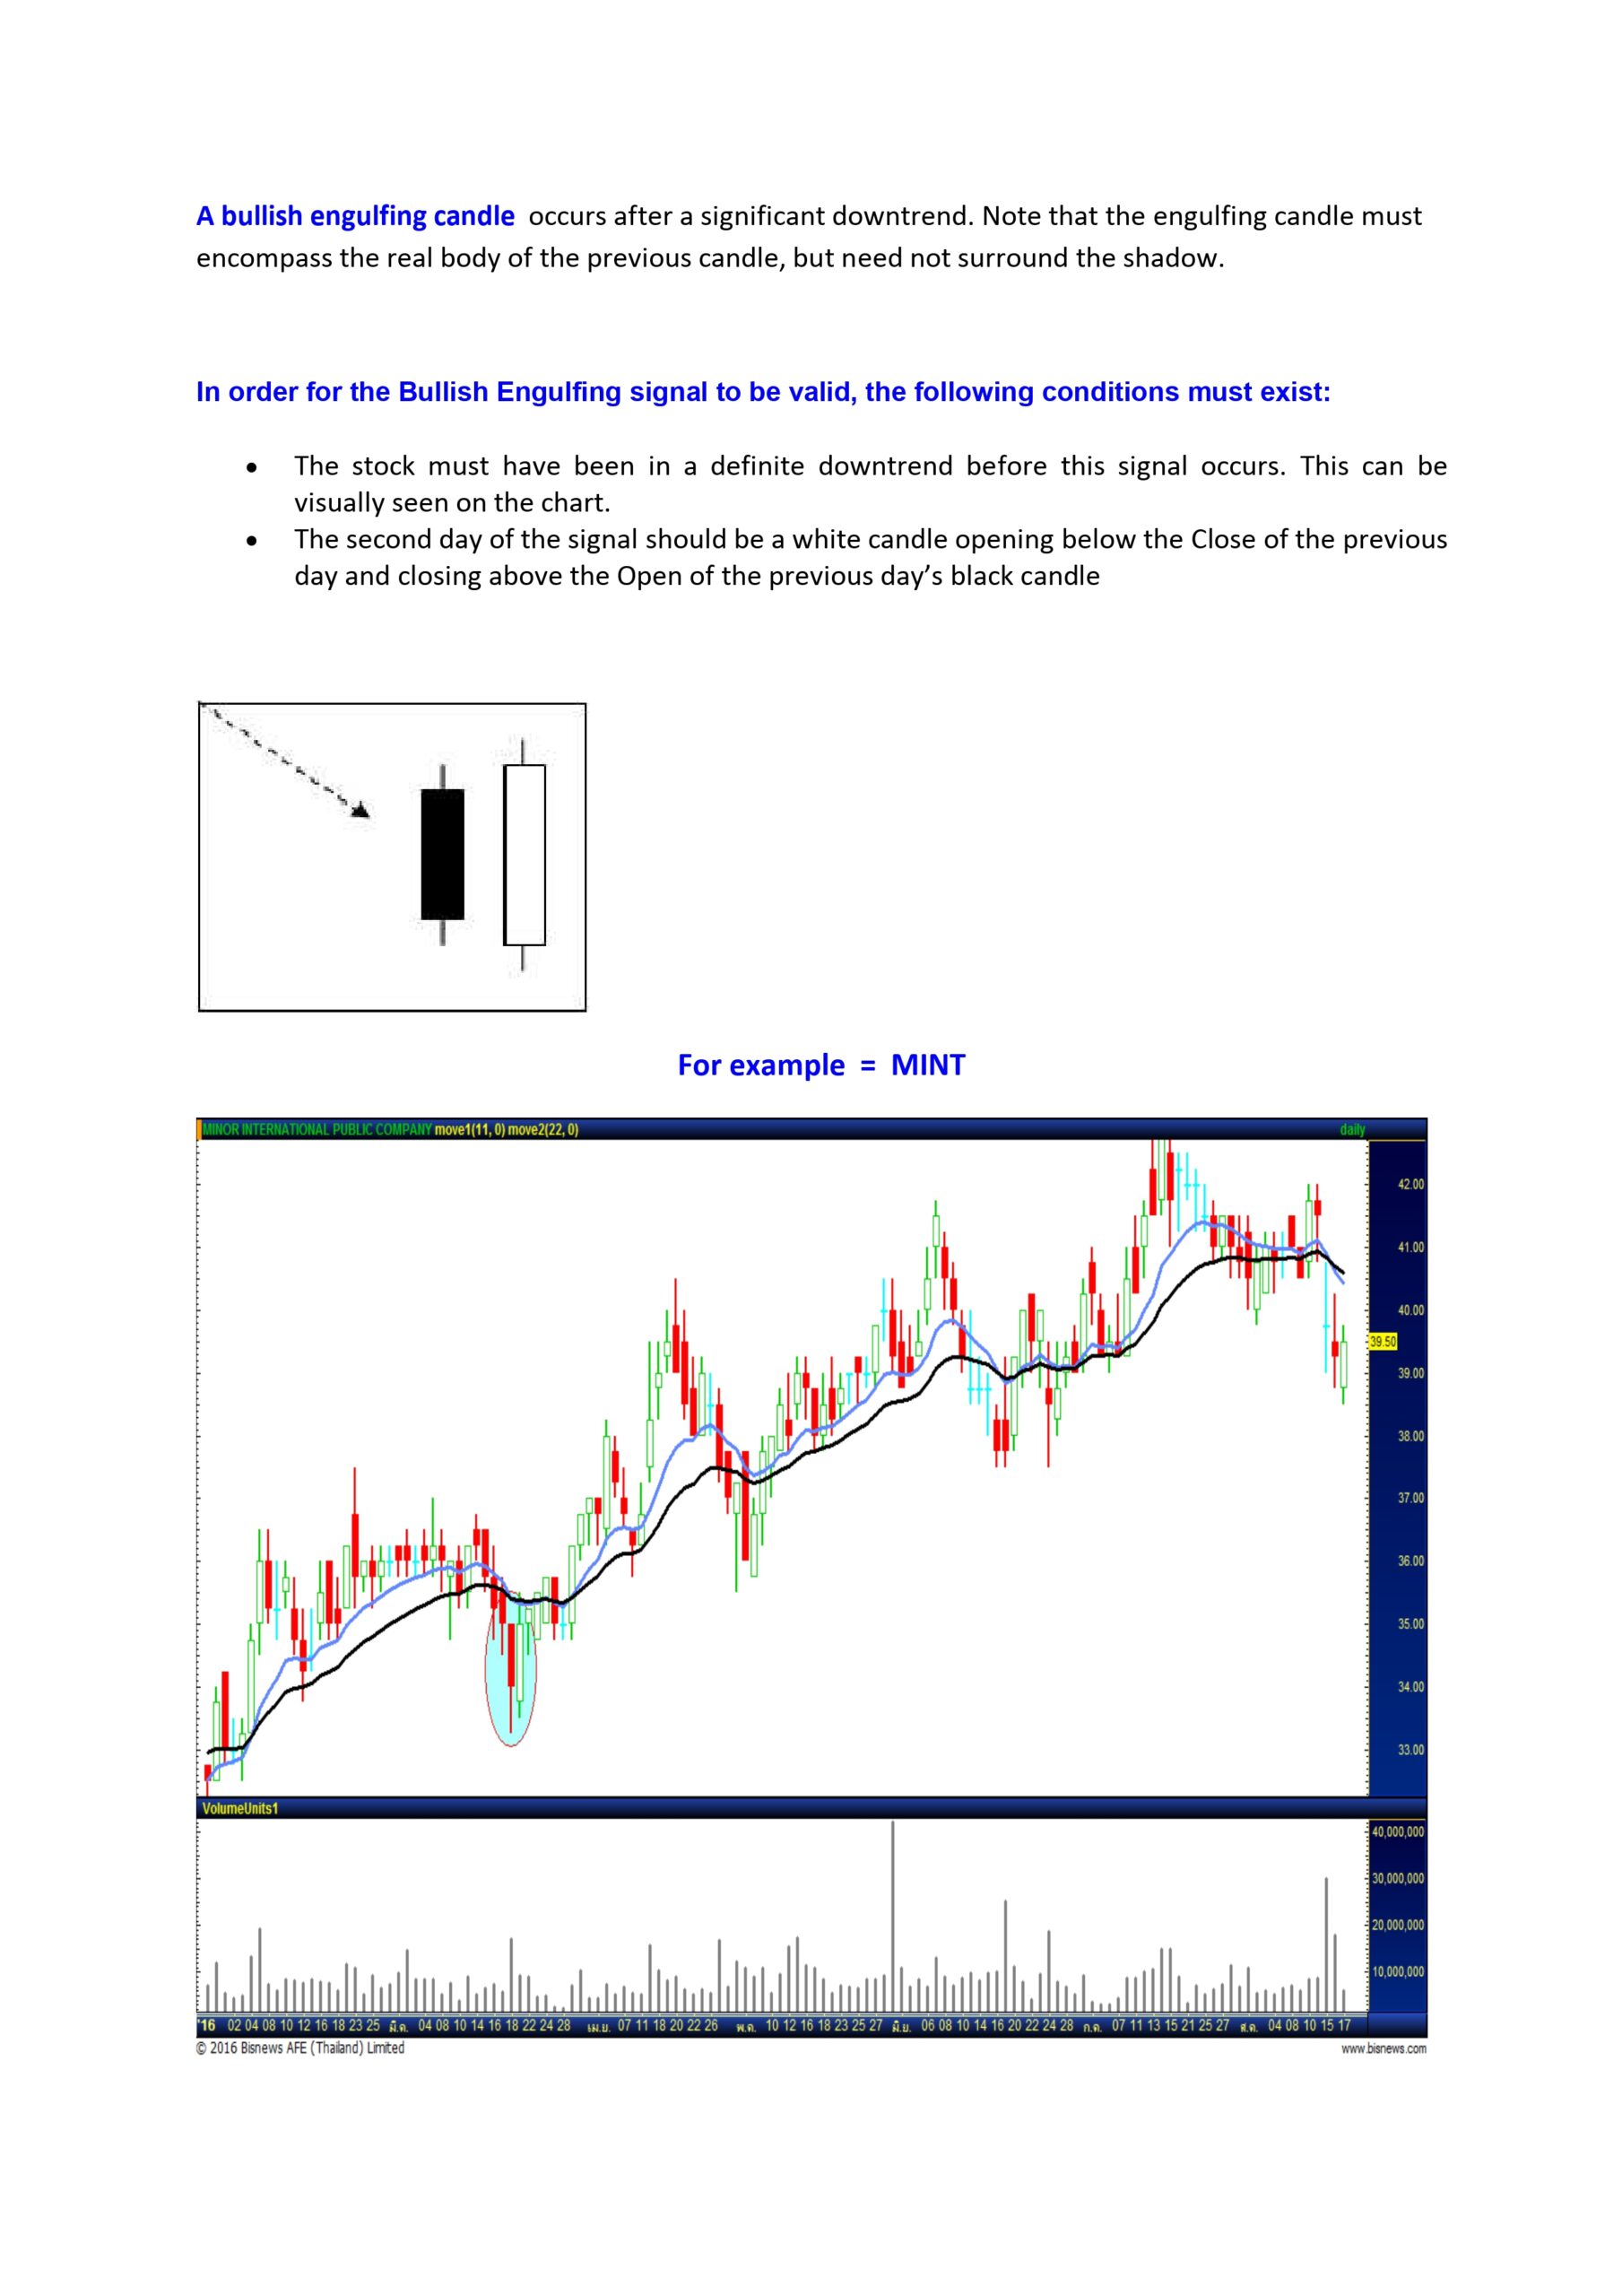
A bullish engulfing candlestick pattern is a two-candlestick reversal pattern that signals a potential uptrend reversal after a downtrend. It consists of a small black candlestick followed by a large white candlestick, where the white candle’s body completely engulfs the black candle’s body. Traders react to this pattern by taking a long position, buying the stock and holding it with the expectation of selling at a higher price in the future.
This pattern indicates a shift in market sentiment from bearish to bullish, with buyers taking control after a previous downward trend. To identify a bullish engulfing pattern, traders look for a pronounced downtrend, a small bearish candle followed by a larger bullish candle that completely covers the previous one, and the closing price of the bullish candle higher than the previous candle’s open price.
A bullish engulfing candle is a key pattern in technical analysis used to identify potential reversals in the market, particularly from a downtrend to an uptrend. This pattern is comprised of two candles and occurs on a candlestick chart, which is commonly used in trading to visualize price movements over a specified period.
Characteristics of a Bullish Engulfing Candle:
- Downtrend Preceding the Pattern: The market should be in a clear downtrend before the appearance of a bullish engulfing pattern, as this adds significance to the potential reversal signal.
- First Candle (Smaller Bearish Candle): The first candle in the pattern is a bearish candle (i.e., the closing price is lower than the opening price), typically colored red or black. This candle indicates that the sellers were in control.
- Second Candle (Larger Bullish Candle): The second candle is a bullish candle (i.e., the closing price is higher than the opening price), typically colored green or white. This candle must completely engulf the body of the first bearish candle, meaning it opens lower than the previous close and closes higher than the previous open.
Interpretation:
- Reversal Signal: The bullish engulfing pattern suggests a potential reversal from a downtrend to an uptrend. The larger bullish candle indicates a strong shift in momentum from sellers to buyers.
- Confirmation Needed: While the pattern itself is a bullish signal, traders often look for additional confirmation before taking action. Confirmation might come in the form of higher trading volume accompanying the bullish candle or subsequent bullish candles continuing the upward momentum.
- Support and Resistance Levels: It’s beneficial to consider this pattern in conjunction with key support and resistance levels, as these can provide additional context for the potential reversal.
Example:
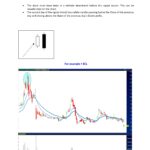
Consider a stock in a downtrend, with daily candlestick charts showing a series of red candles. On a particular day, a small red candle is followed by a larger green candle that completely engulfs the previous day’s red candle. This pattern suggests that the selling pressure may be diminishing, and buyers are stepping in, indicating a potential upward reversal.
Practical Application:
- Entry Point: Traders might consider entering a long position (buying) if a bullish engulfing pattern is confirmed by the next day’s price action or by other technical indicators such as an increase in volume or a break above a resistance level.
- Stop-Loss Placement: To manage risk, traders often place stop-loss orders below the low of the bullish engulfing pattern to protect against false signals.
Limitations:
- False Signals: Like all technical patterns, the bullish engulfing pattern is not foolproof and can sometimes give false signals, particularly in highly volatile markets.
- Market Context: It’s essential to consider the overall market context and use the pattern in conjunction with other technical analysis tools and indicators to increase the reliability of the signal.
By understanding and correctly identifying the bullish engulfing candle pattern, traders can improve their ability to anticipate market reversals and make more informed trading decisions.
what is the difference between bullish and bearish engulfing candlestick patterns
The main difference between bullish and bearish engulfing candlestick patterns lies in their implications for market trends.
- Bullish Engulfing Pattern: This pattern signals a reversal of a downtrend, indicating a rise in buying pressure. It appears at the bottom of a downtrend, with the second green candle completely engulfing the body of the previous red candle. This reversal suggests that more buyers are entering the market, pushing prices up further
. Bearish Engulfing Pattern: In contrast, the bearish engulfing pattern signifies a reversal of an uptrend, indicating a fall in prices due to increased selling pressure. It appears at the top of an uptrend, with the second bearish candle completely engulfing the body of the previous green candle. This reversal indicates that more sellers are entering the market, leading to a decline in prices
Therefore, while the bullish engulfing pattern suggests a shift from a bearish to a bullish trend, the bearish engulfing pattern indicates a shift from a bullish to a bearish trend


