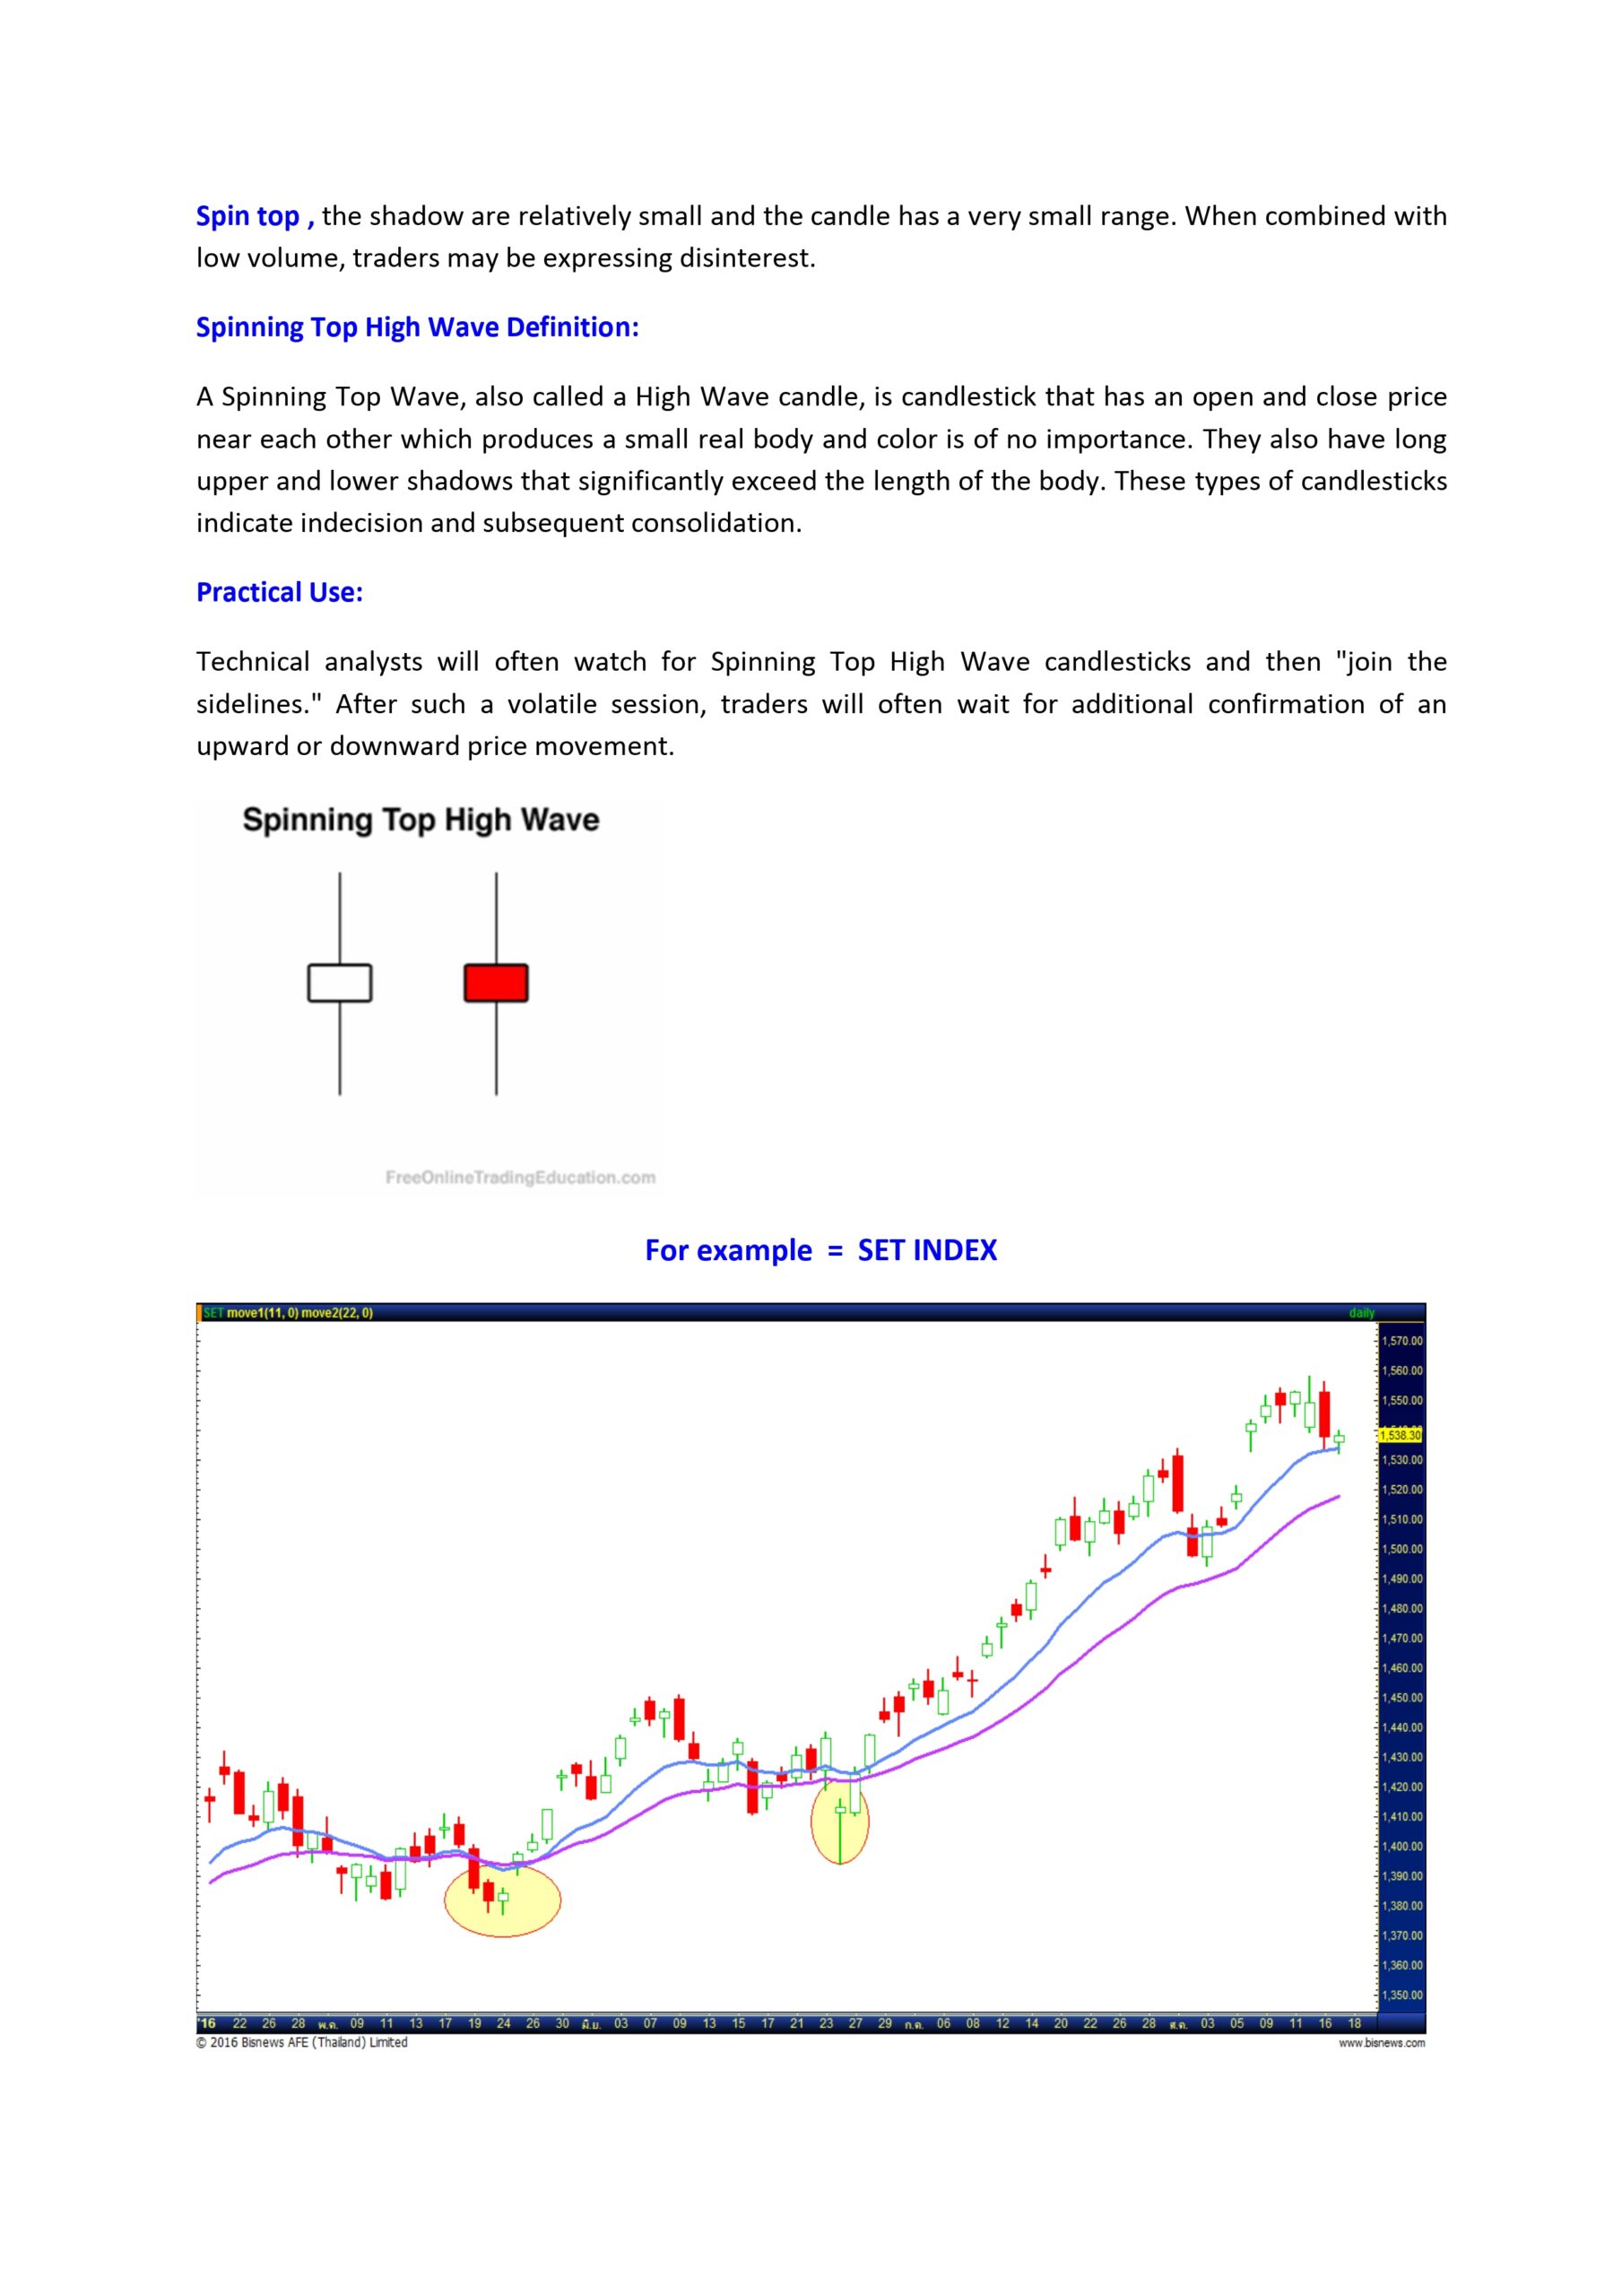
A spin top candlestick is a type of candlestick pattern that appears on a candlestick chart used in technical analysis. It is characterized by a small real body (the difference between the opening and closing prices) and long upper and lower shadows. This pattern indicates indecision in the market, as neither buyers nor sellers are able to gain control.
A spinning top candlestick is a single candlestick pattern that represents indecision about future price movement. It is characterized by a small real body (the difference between the opening and closing prices) and long upper and lower shadows of approximately equal length. The small real body indicates that the open and close prices are very close together, so the color of the candle (bullish green or bearish red) is not very important. The long upper and lower shadows show high volatility during the trading period, with neither bulls nor bears able to gain control. A spinning top forms when the price rises above the opening price but then falls back to close near the open, or vice versa. This back-and-forth price action suggests a tough battle between buyers and sellers, with neither side able to sustain momentum. The meaning of a spinning top depends on its context in the overall trend:
- After an uptrend, it can signal that the bulls are losing momentum and a bearish reversal may be coming
. After a downtrend, it may indicate the bears are weakening and a bullish reversal is possible
However, a spinning top alone is not a very reliable signal. Traders often wait for confirmation from the next candle or use the pattern in conjunction with other technical indicators to increase the odds of an accurate prediction. In summary, the spinning top candlestick pattern is a visual representation of market indecision that can provide clues about potential trend reversals, but should be interpreted cautiously and in context.
what are some other candlestick patterns used in technical analysis
Based on the search results, here are some other common candlestick patterns used in technical analysis: Doji: A doji candlestick has a very small real body, indicating indecision in the market as the open and close prices are nearly the same. Dojis can signal potential trend reversals when found in the right context. Inverted hammer: The inverted hammer is a single candlestick pattern that appears at the bottom of a downtrend. It has a small real body and a long upper shadow, suggesting buying pressure and a potential bullish reversal. Piercing line: The piercing line is a two-candlestick bullish reversal pattern that occurs after a downtrend. The second candle opens lower than the first but closes above the midpoint of the first candle’s body, indicating buying pressure. Falling three methods: This is a bearish continuation pattern consisting of a long red candle, followed by three small green candles contained within the range of the red candles, and then another red candle. It suggests the downtrend is likely to continue. These are just a few examples of the many candlestick patterns traders use to analyze price movements and identify potential trading opportunities. Mastering candlestick pattern recognition is an important skill in technical analysis.
how can spinning top candlestick patterns be used in trading strategies
Spinning top candlestick patterns can be used in trading strategies to identify potential market reversals or continuations based on market indecision. Here are some key points on how to utilize spinning top candlestick patterns in trading strategies based on the provided sources:
- Identifying Spinning Top Candlestick Patterns:
- Look for candlesticks with a small body and long upper and lower shadows, indicating indecision in the market.
- The color of the candlestick (bullish or bearish) is not crucial for interpretation.
- Confirm that the open and close prices are close together, with long shadows of approximately equal length extending from both ends of the body.
- Interpreting Spinning Top Candlestick Patterns:
- In an uptrend, a spinning top may suggest a potential bearish reversal as buyers lose control.
- In a downtrend, it could indicate a possible bullish reversal as sellers lose momentum.
- Confirmation from the next candle or other technical indicators is essential before making trading decisions.
- Trading with Spinning Top Candlestick Patterns:
- Use technical indicators to confirm the signal provided by the spinning top pattern.
- Consider using derivatives like CFDs to trade based on the potential price movements indicated by spinning tops.
- Wait for confirmation from the next candle or other technical indicators before entering a trade based on a spinning top pattern.
By incorporating spinning top candlestick patterns into trading strategies, traders can gain insights into market sentiment and potential price movements, enhancing their decision-making process and improving the odds of successful trades


