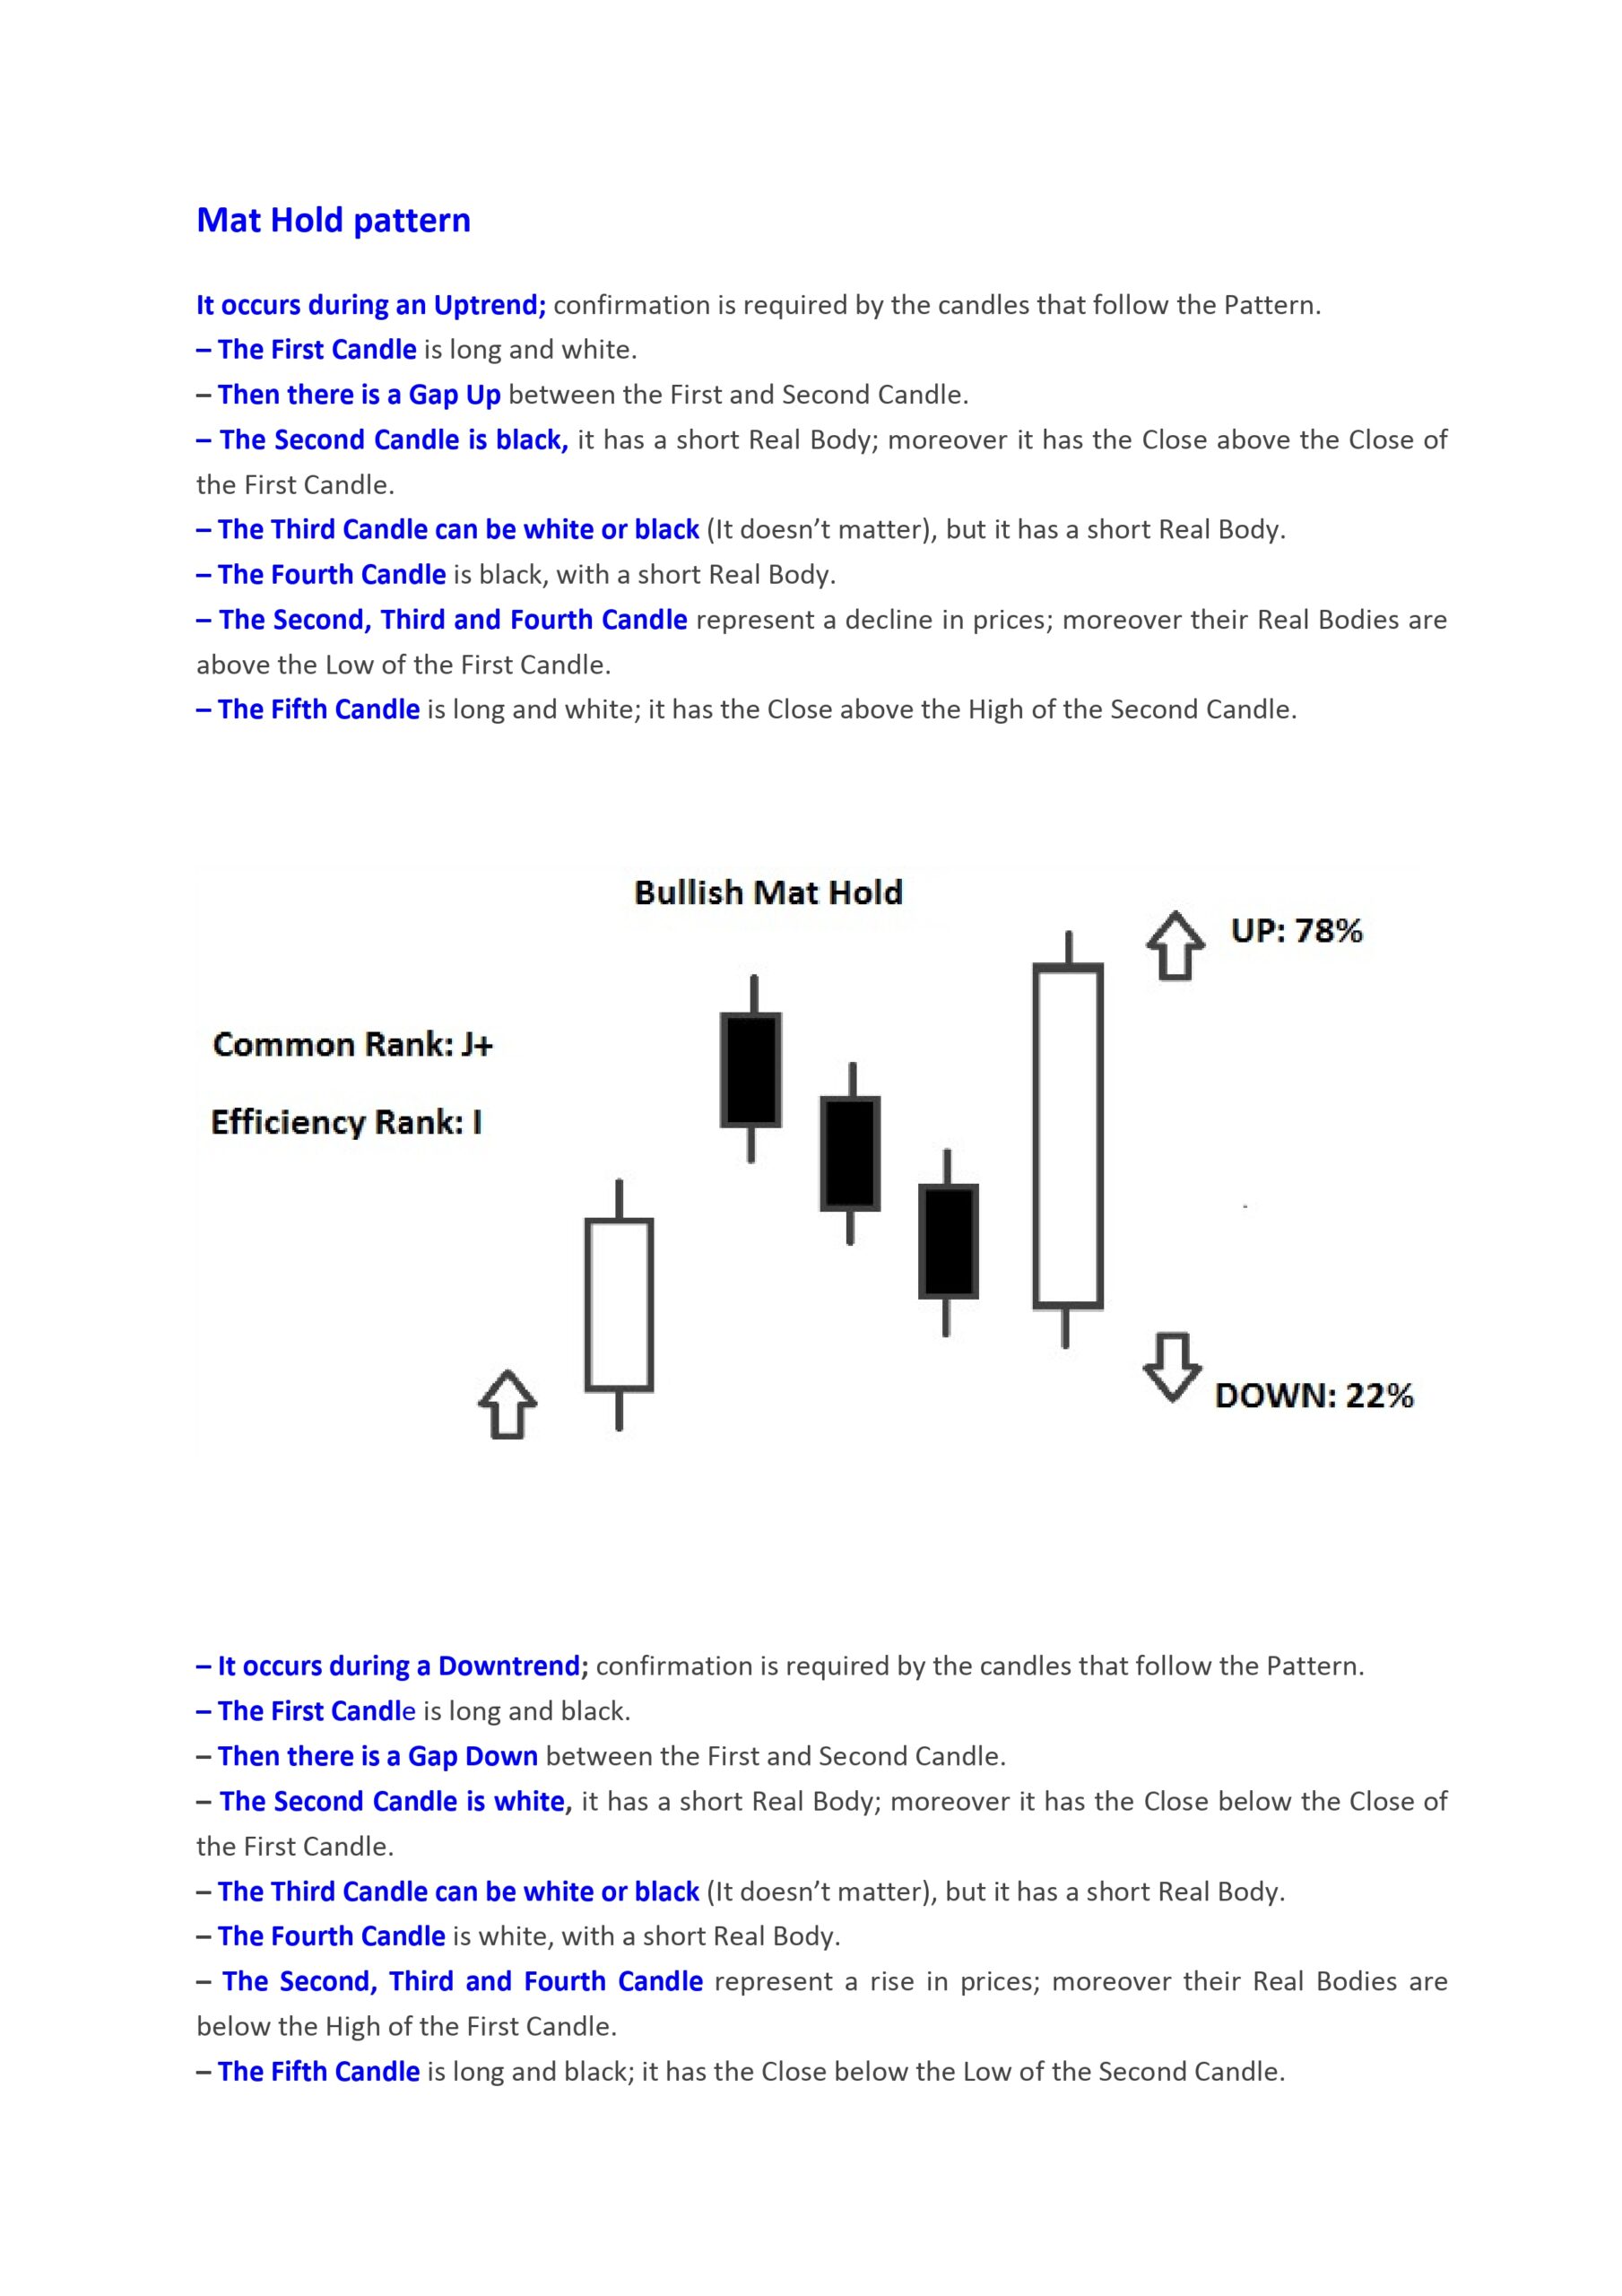
A “mat hold pattern” is a technical analysis pattern used in stock trading to predict the continuation of an existing trend. It is particularly useful in assessing the strength of a prevailing trend and the likelihood of its continuation. Here’s a detailed look at the mat hold pattern:
Characteristics of a Mat Hold Pattern
- Trend Context:
- Uptrend: The pattern occurs during an established upward trend.
- Downtrend: The pattern occurs during an established downward trend.
- Pattern Formation:
- First Candle: A large candle in the direction of the current trend (bullish in an uptrend, bearish in a downtrend).
- Second to Fourth Candles: These are typically smaller candles (often with mixed or counter-trend direction) that consolidate but stay within the range of the first candle. This forms the “mat” or the consolidation phase.
- Fifth Candle: Another large candle that resumes the original trend, confirming the continuation of the trend.
Interpretation
- Bullish Mat Hold Pattern:
- Occurs during an uptrend.
- Starts with a long bullish candle.
- Followed by three small candles that do not significantly penetrate the first candle’s range.
- Ends with a long bullish candle, signaling the continuation of the uptrend.
- Bearish Mat Hold Pattern:
- Occurs during a downtrend.
- Starts with a long bearish candle.
- Followed by three small candles that do not significantly penetrate the first candle’s range.
- Ends with a long bearish candle, signaling the continuation of the downtrend.
Significance
- Confirmation of Trend: The mat hold pattern is seen as a strong continuation pattern, providing traders with confidence that the current trend will persist.
- Market Psychology: The pattern reflects a brief period of consolidation or pause in the market before the trend resumes, indicating that the initial trend still has momentum.
- Entry and Exit Points: Traders use the breakout candle (fifth candle) to time their entries or exits, entering in the direction of the original trend after the pattern confirms.
Trading Strategy
- Entry Point: Traders typically enter a position in the direction of the trend upon the close of the fifth candle.
- Stop-Loss Placement: A stop-loss can be placed below the low of the consolidation candles for bullish patterns, or above the high of the consolidation candles for bearish patterns, to manage risk.
- Profit Targets: Profit targets can be set based on a multiple of the initial risk (e.g., 2:1 reward-to-risk ratio) or using other technical indicators like resistance levels for bullish patterns or support levels for bearish patterns.
Example
- Bullish Mat Hold Pattern Example:
- The stock is in an uptrend.
- Day 1: A strong bullish candle forms.
- Days 2-4: Three small candles form within the range of the first candle.
- Day 5: Another strong bullish candle forms, breaking above the previous range, signaling the continuation of the uptrend.
- Bearish Mat Hold Pattern Example:
- The stock is in a downtrend.
- Day 1: A strong bearish candle forms.
- Days 2-4: Three small candles form within the range of the first candle.
- Day 5: Another strong bearish candle forms, breaking below the previous range, signaling the continuation of the downtrend.
By recognizing and understanding the mat hold pattern, traders can enhance their ability to anticipate market movements and make more informed trading decisions.


