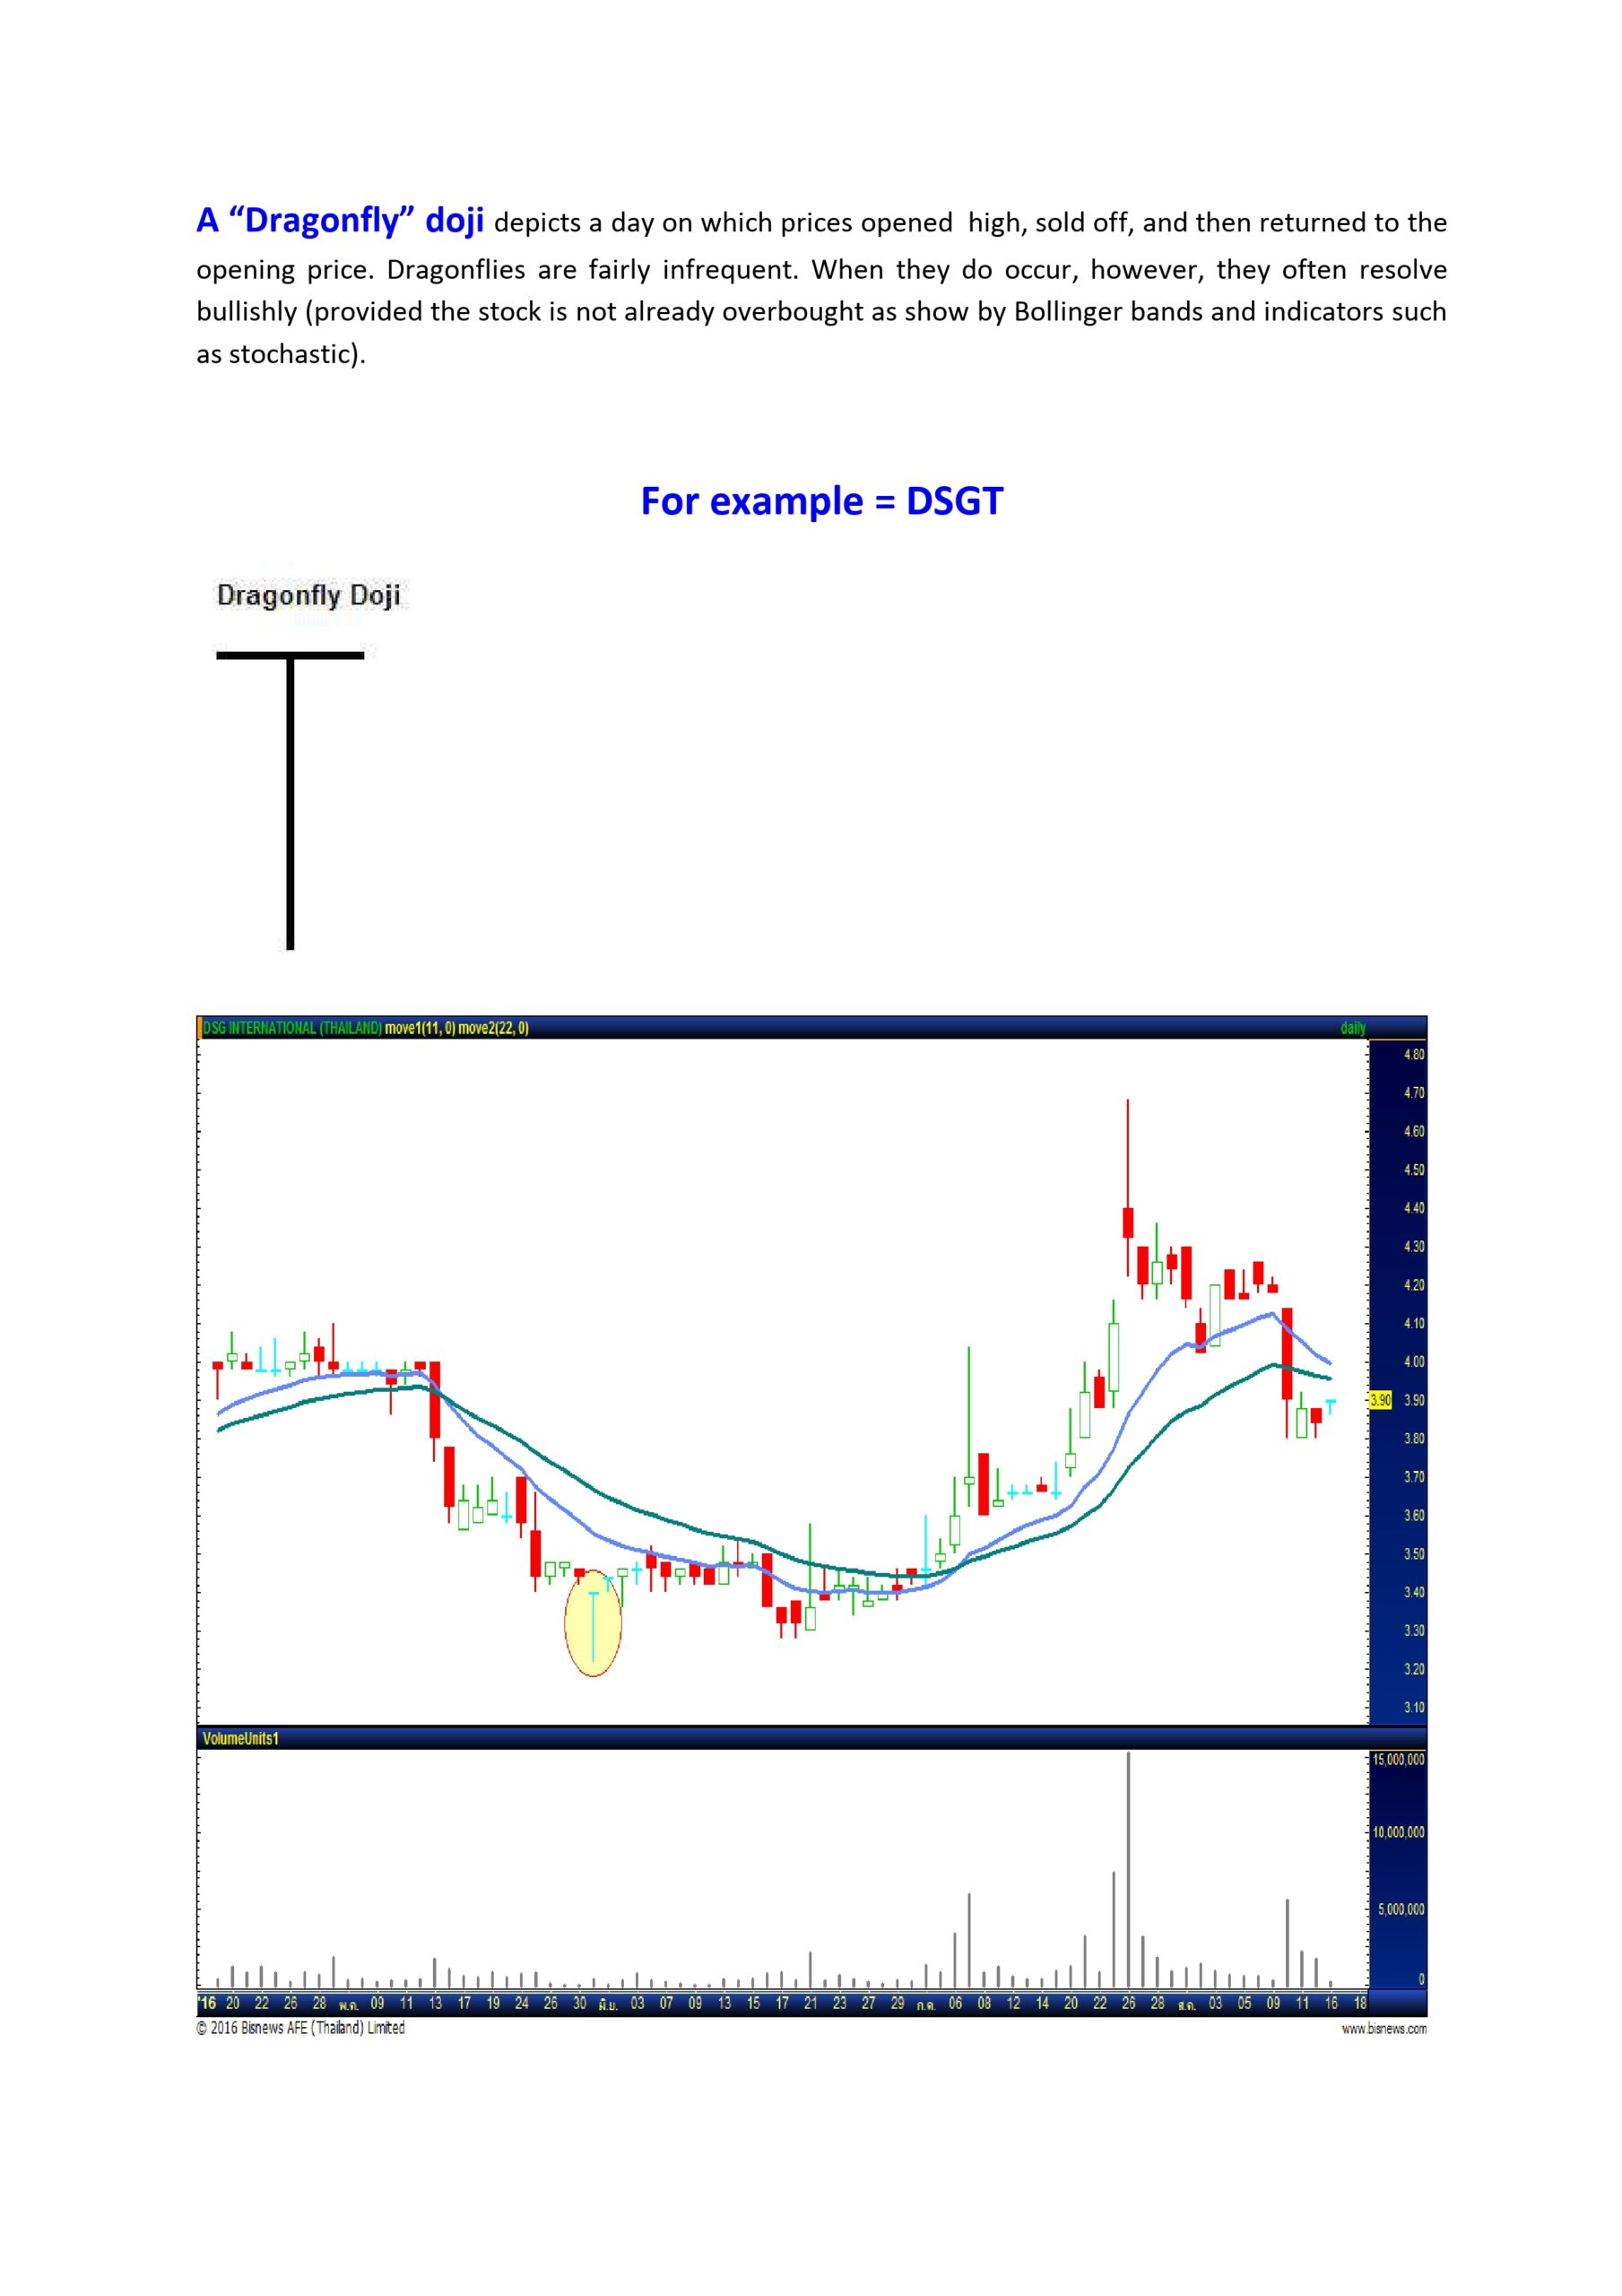
A Dragonfly Doji is a specific type of candlestick pattern used in technical analysis of financial markets. It occurs when the open, high, and close prices are all near the low of the period, resulting in a candlestick that resembles a “T” shape. Here’s a breakdown of its key features and implications:
Key Features
- Formation: The Dragonfly Doji has a long lower shadow with little or no upper shadow. The open, high, and close prices are all at or near the high of the day.
- Appearance: It looks like a lowercase “t”, with a long lower wick and a very short (or nonexistent) upper wick and body.
Implications
- Bullish Reversal Signal: It is often considered a bullish reversal signal when it appears at the bottom of a downtrend. This pattern suggests that sellers dominated the market during the early part of the period, pushing prices down. However, buyers regained control, pushing prices back up to the opening level by the end of the period.
- Market Sentiment: It indicates a shift in market sentiment from bearish to bullish, as the strong downward movement is rejected, and the price returns to the high of the day.
Trading Strategy
- Confirmation: Traders typically look for confirmation in the next period’s candlestick to validate the reversal signal. A bullish confirmation might be an upward move or a bullish candlestick in the next trading session.
- Stop-Loss: It’s prudent to place a stop-loss order below the low of the Dragonfly Doji to manage risk, as a drop below this level might invalidate the bullish reversal signal.
Example
Imagine a stock that has been in a downtrend, and on a particular day, the price opens at $50, drops to $45 during the day, but then rallies back to close at $50. This forms a Dragonfly Doji, suggesting that despite the significant selling pressure, buyers managed to bring the price back up, indicating potential bullishness in the following sessions.
Interpretation in Different Contexts
- In Uptrends: If a Dragonfly Doji appears during an uptrend, it might indicate indecision or a potential top, but this is less common. It’s more significant as a reversal signal in a downtrend.
- Volume Consideration: High trading volume on the day of a Dragonfly Doji can add strength to the signal, indicating strong buying interest at the lower levels.
In summary, the Dragonfly Doji is a powerful candlestick pattern that can indicate a potential reversal from bearish to bullish sentiment, especially when it appears after a sustained downtrend and is confirmed by subsequent trading action.
what is the significance of the long lower wick in dragonfly doji
The long lower wick is the most significant feature of the Dragonfly Doji candlestick pattern. It indicates the following:
- The long lower shadow shows that sellers initially drove prices down during the trading period, but intensive buying pressure then brought the price back up to close near the open
. It demonstrates a failed bearish advance and hints at an impending bullish reversal, especially when the Dragonfly Doji appears at the bottom of a downtrend. The presence of the long lower shadow suggests that buyers were able to push prices higher from the session low, potentially signaling a bullish reversal. The longer the lower wick, the more significant the bullish signal, as it shows the sellers were unable to keep prices down and the buyers absorbed the selling pressure
- .
So in summary, the long lower shadow is crucial in the Dragonfly Doji as it shows the buying pressure overcame the selling pressure during the trading period, hinting at a potential trend reversal from bearish to bullish. The longer the lower wick, the stronger the bullish signal.
how does dragonfly doji compare to other candlestick patterns in terms of predicting trend reversals
The Dragonfly Doji is a unique candlestick pattern that signals potential trend reversals. It is characterized by a long lower wick and a small real body at or near the top of the candle’s range, indicating that buyers have begun stepping in to halt a downtrend. In comparison to other candlestick patterns, the Dragonfly Doji has distinct features that set it apart in terms of predicting trend reversals: Dragonfly Doji vs. Gravestone Doji: Both patterns have a small real body near one end of the candlestick and a long shadow on the opposite side. The Gravestone Doji has the open/close near the low with an extended upper shadow, indicating potential bearish reversals. In contrast, the Dragonfly Doji has the open/close near the high with a prolonged lower wick, suggesting bullish signals and trend exhaustion.
Dragonfly Doji vs. Spinning Top: A spinning top has a small real body and long upper and lower shadows, representing indecision between buyers and sellers. The Dragonfly Doji, with its long lower wick and small body at the top, indicates a stronger bullish signal than a spinning top, hinting at potential trend reversals. Dragonfly Doji vs. Hammer: While both anticipate bullish reversals, the Dragonfly Doji opens and closes at the same price, showing indecision and potential trend shifts. In contrast, a Hammer opens lower and closes under the opening price, signaling bullish momentum.
Dragonfly Doji vs. Long-Legged Doji: The long-legged doji has long upper and lower shadows, indicating significant price volatility and indecision among traders. It typically forms when the open and close are near the middle of the trading range. While it doesn’t provide a clear directional signal like the dragonfly doji, it suggests uncertainty in the market and potential for a reversal or continuation depending on the context.
Dragonfly Doji vs. Shooting Star: The shooting star is the bearish counterpart to the hammer. It has a small body near the low of the session and a long upper shadow. This pattern forms when prices rise significantly during the session but then retreat by the close, suggesting a potential reversal of the uptrend. In summary, the Dragonfly Doji is a distinct candlestick pattern that signals potential trend reversals, particularly bullish reversals after a downtrend. Its long lower wick and small real body at the top of the candle’s range set it apart from other patterns, such as the Gravestone Doji, Spinning Top, Hammer, Long-Legged Doji, and Shooting Star. Each of these patterns has its own unique characteristics and implications for traders, and understanding these distinctions is crucial for making informed trading decisions
what are some other candlestick patterns that are commonly used to predict trend reversals
Some other commonly used candlestick patterns to predict trend reversals include:
- Morning Star: A bullish reversal pattern that consists of three candles – a tall black candle, a lower small candle, and a third tall white candle that closes above the mid-point of the first candle
. Three Line Strike: This reliable bullish reversal pattern involves three falling black candles followed by a tall white candle that opens below the preceding close and closes above the highest open. Engulfing: A reliable bullish reversal pattern where a black candle is followed by a taller white body that opens below the previous body and closes above it. Belt Hold: A reliable bullish reversal pattern characterized by a tall white candle where the open gaps down from the previous close and is the low for the day, with no lower shadow and a close near the high. Abandoned Baby: This reliable bullish reversal pattern starts with a tall black candle followed by a lower Doji candle and then a long white candle that opens above the body of the second candle. Three Inside Up: A weak bullish reversal pattern that involves a Harami pattern followed by a white candle that closes above the body of the first candle. Piercing Line: A weak bullish reversal pattern where a tall black candle is immediately followed by a tall white candle that closes above the mid-point of the preceding body. Breakaway: A weak bullish reversal pattern starting with a tall black candle that gaps down to a shorter black candle, followed by two shorter candles and ending with a tall white candle closing above the highs of the preceding three candles. Downside Gap Three Methods: A weak bullish reversal pattern where a tall black candle gaps down to a second tall black candle, followed by a long white candle that closes within the body of the first candle
- .
These patterns, along with the Dragonfly Doji and others, are commonly used by traders to identify potential trend reversals in the financial markets


