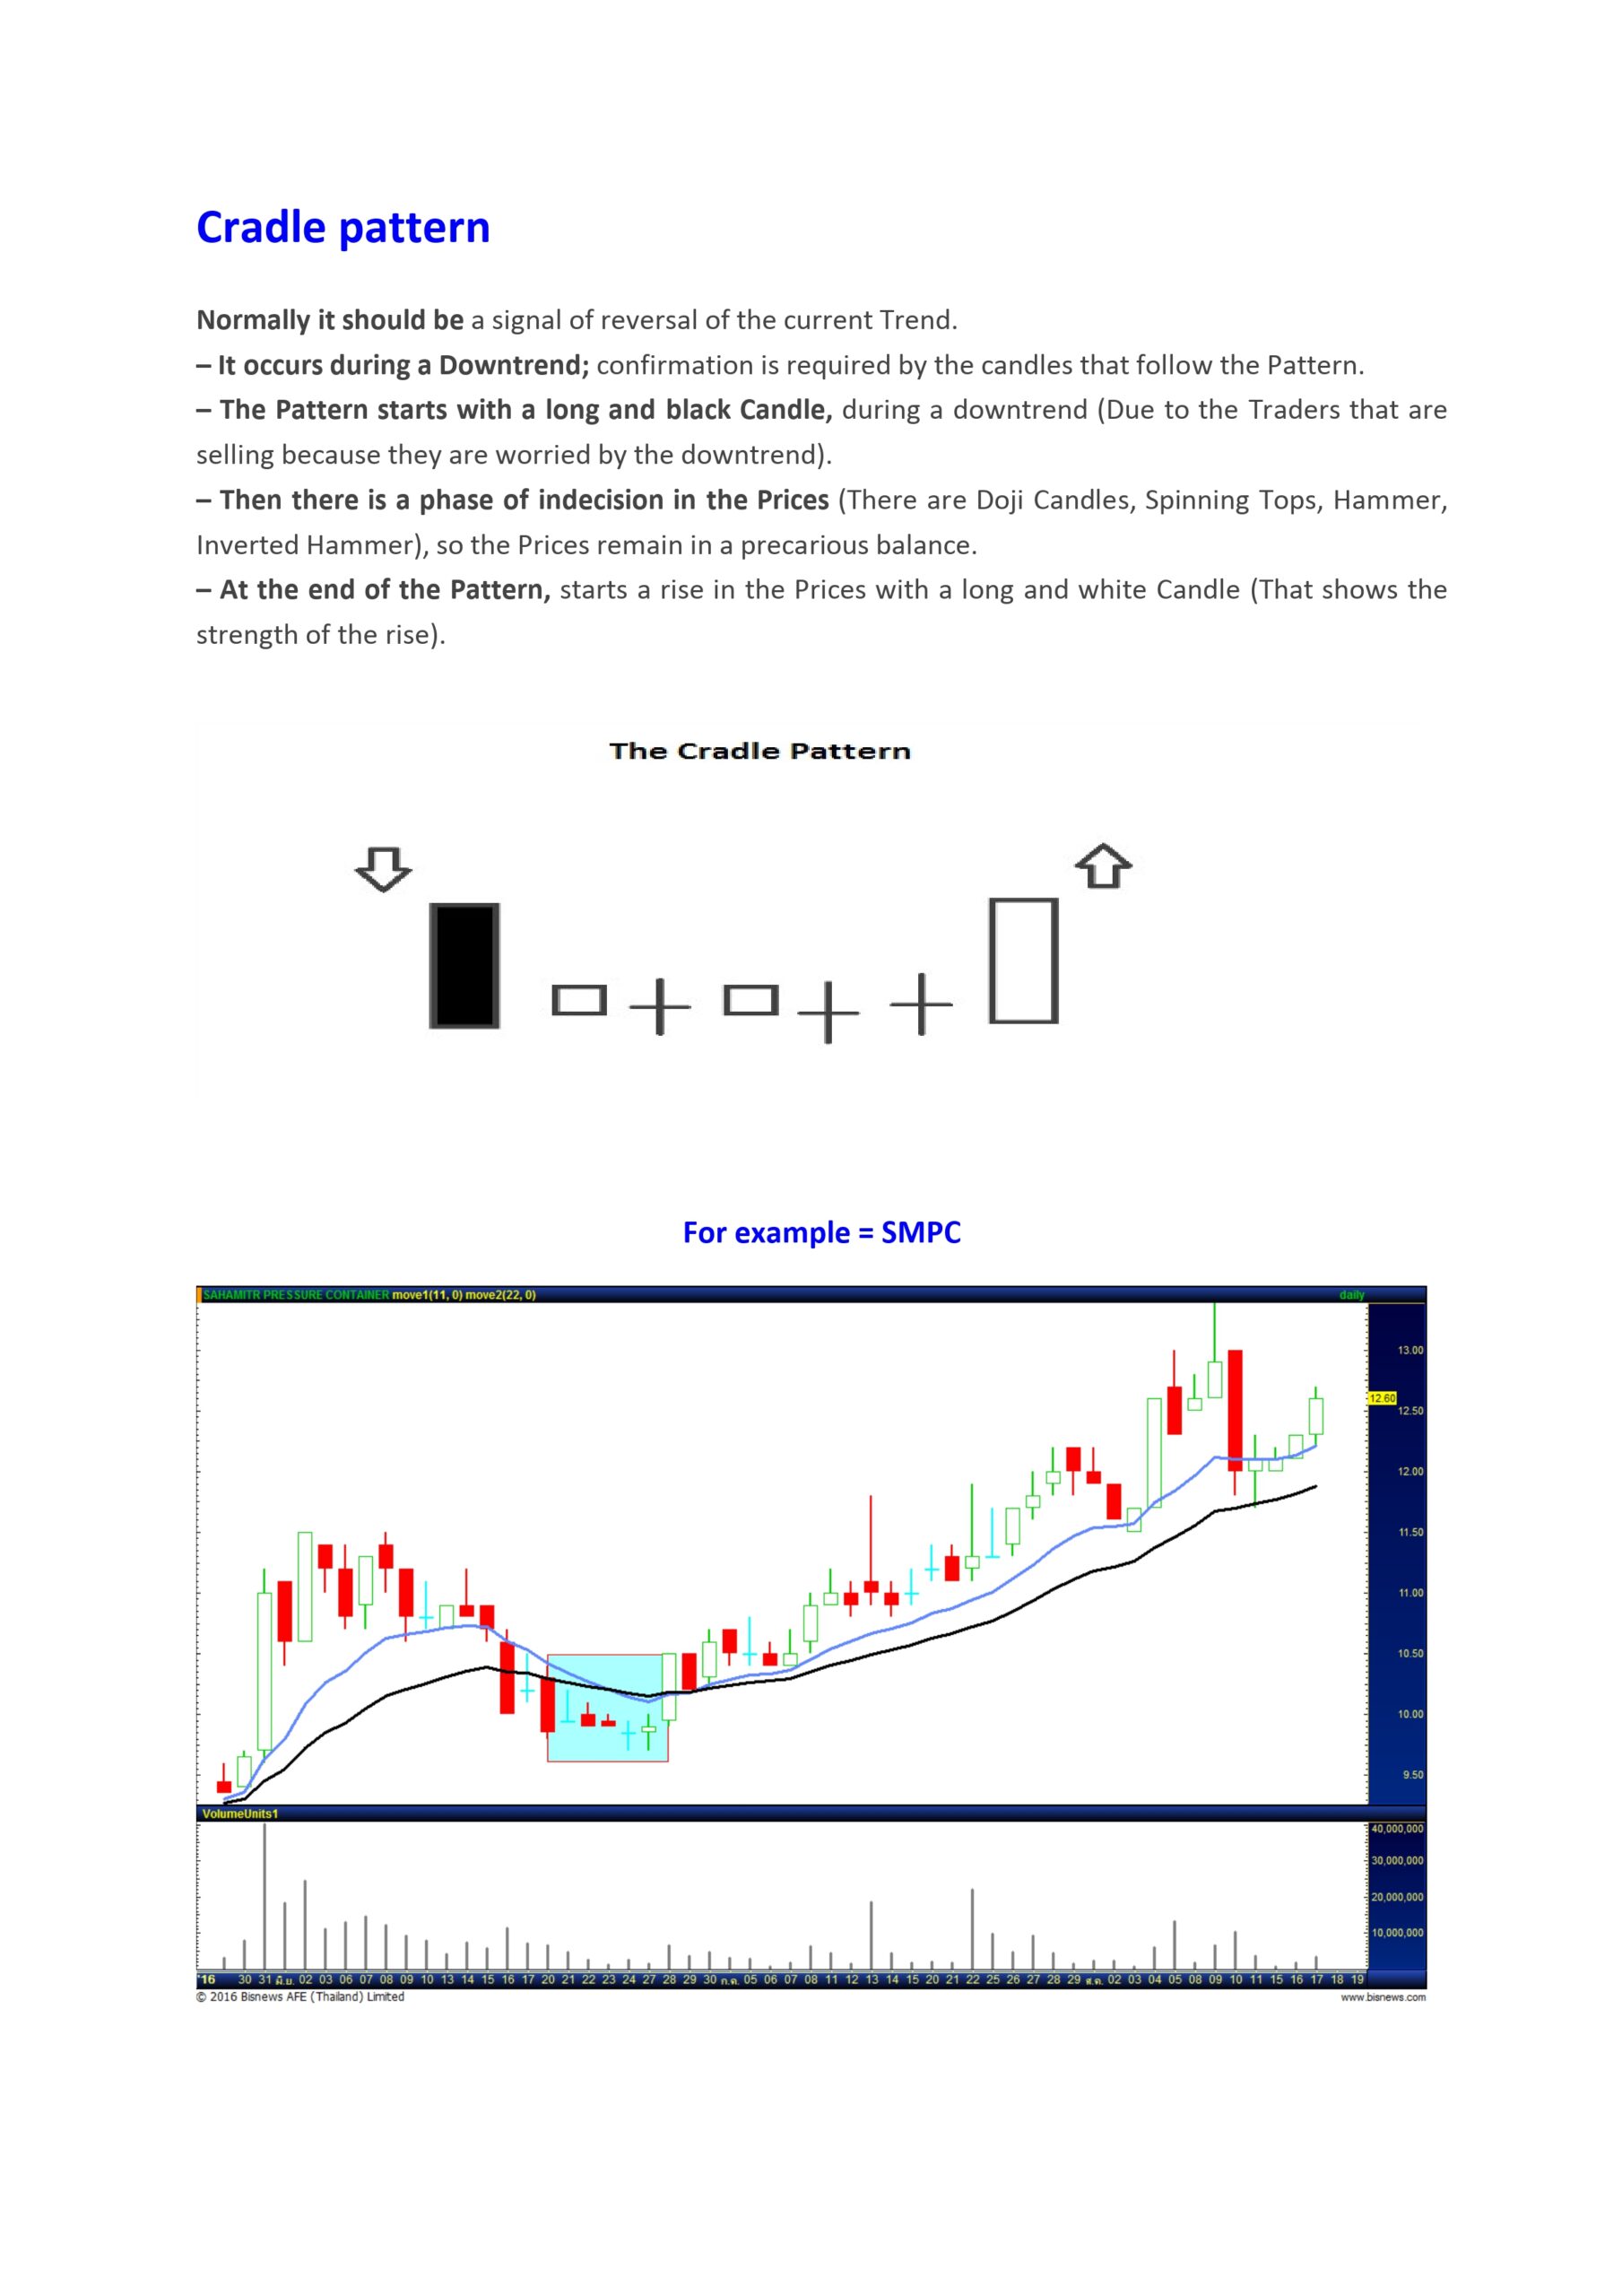
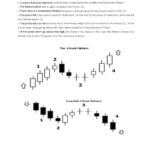
The cradle pattern is a bullish reversal candlestick pattern that typically forms at the bottom of a downtrend. It consists of the following elements:
- A large, bearish candlestick that represents extensive selling pressure at the bottom of the downtrend.
- One or more indecisive candlestick patterns like Doji, Spinning Top, Hammer, or Inverted Hammer, indicating the selling pressure has stopped.
- A final, bullish candlestick that confirms the reversal, showing strength in the upward move.
The pattern is named “cradle” because the large bearish candlestick acts as the “headboard” and the final bullish candlestick acts as the “footboard”, with the indecisive candles forming the “cradle” in between. The cradle pattern suggests that the downtrend is likely to reverse and move higher from that point. However, the pattern requires confirmation from the subsequent candlesticks before considering it a reliable reversal signal. The cradle pattern was first introduced by technical analyst Stephen Bigalow in his book “High Profit Candlestick Patterns”. It is considered a high-profit candlestick pattern that can help traders identify potential trend reversals.
The cradle pattern, also known as the “Cradle Bottom,” is a technical analysis chart pattern used in stock trading to identify potential reversals from a downtrend to an uptrend. This pattern is considered bullish and suggests that the stock price may have reached its bottom and is poised for a reversal.
Characteristics of the Cradle Pattern
- Formation: The cradle pattern typically forms after a significant downtrend. It consists of three main parts:
- Left Side: A sharp decline in price, creating the left “arm” of the cradle.
- Bottom: A period of consolidation or a slight rise, forming the base or the “cradle” itself.
- Right Side: A rise in price that mirrors the left side’s decline, forming the right “arm” of the cradle.
- Volume: Volume usually decreases during the formation of the bottom, indicating reduced selling pressure, and increases during the rise on the right side, suggesting growing buying interest.
- Support and Resistance: The pattern often shows a clear support level at the bottom, where the price stops falling and starts consolidating, and a resistance level at the top of the cradle, which is tested and potentially broken during the upward move.
Identifying the Cradle Pattern
To identify a cradle pattern:
- Look for a downtrend with a significant drop in price.
- Identify a period where the price consolidates, showing reduced volatility and lower trading volumes.
- Observe a subsequent increase in price, ideally with increasing volume, signaling the potential start of a new uptrend.
Trading the Cradle Pattern
When trading the cradle pattern:
- Entry Point: Traders typically enter a position when the price breaks above the resistance level formed by the right side of the cradle. This confirms the pattern and the potential start of an uptrend.
- Stop Loss: Place a stop-loss order below the lowest point of the cradle to manage risk in case the pattern fails and the downtrend resumes.
- Target Price: The target price is often set by measuring the depth of the cradle (the distance from the bottom to the resistance level) and projecting that distance upward from the breakout point.
Example
Suppose a stock falls from $50 to $30, consolidates between $30 and $35, and then starts to rise. If it breaks the $35 resistance level with increased volume, this may signal the completion of the cradle pattern and a potential buying opportunity.
Limitations
Like all technical analysis tools, the cradle pattern is not foolproof. It is important to confirm the pattern with other technical indicators and consider the broader market context. False breakouts and pattern failures can occur, so risk management is crucial.
In summary, the cradle pattern is a useful tool for identifying potential reversals in stock prices from a downtrend to an uptrend. It involves analyzing price movements and volumes and requires confirmation with other indicators to increase the likelihood of a successful trade.


