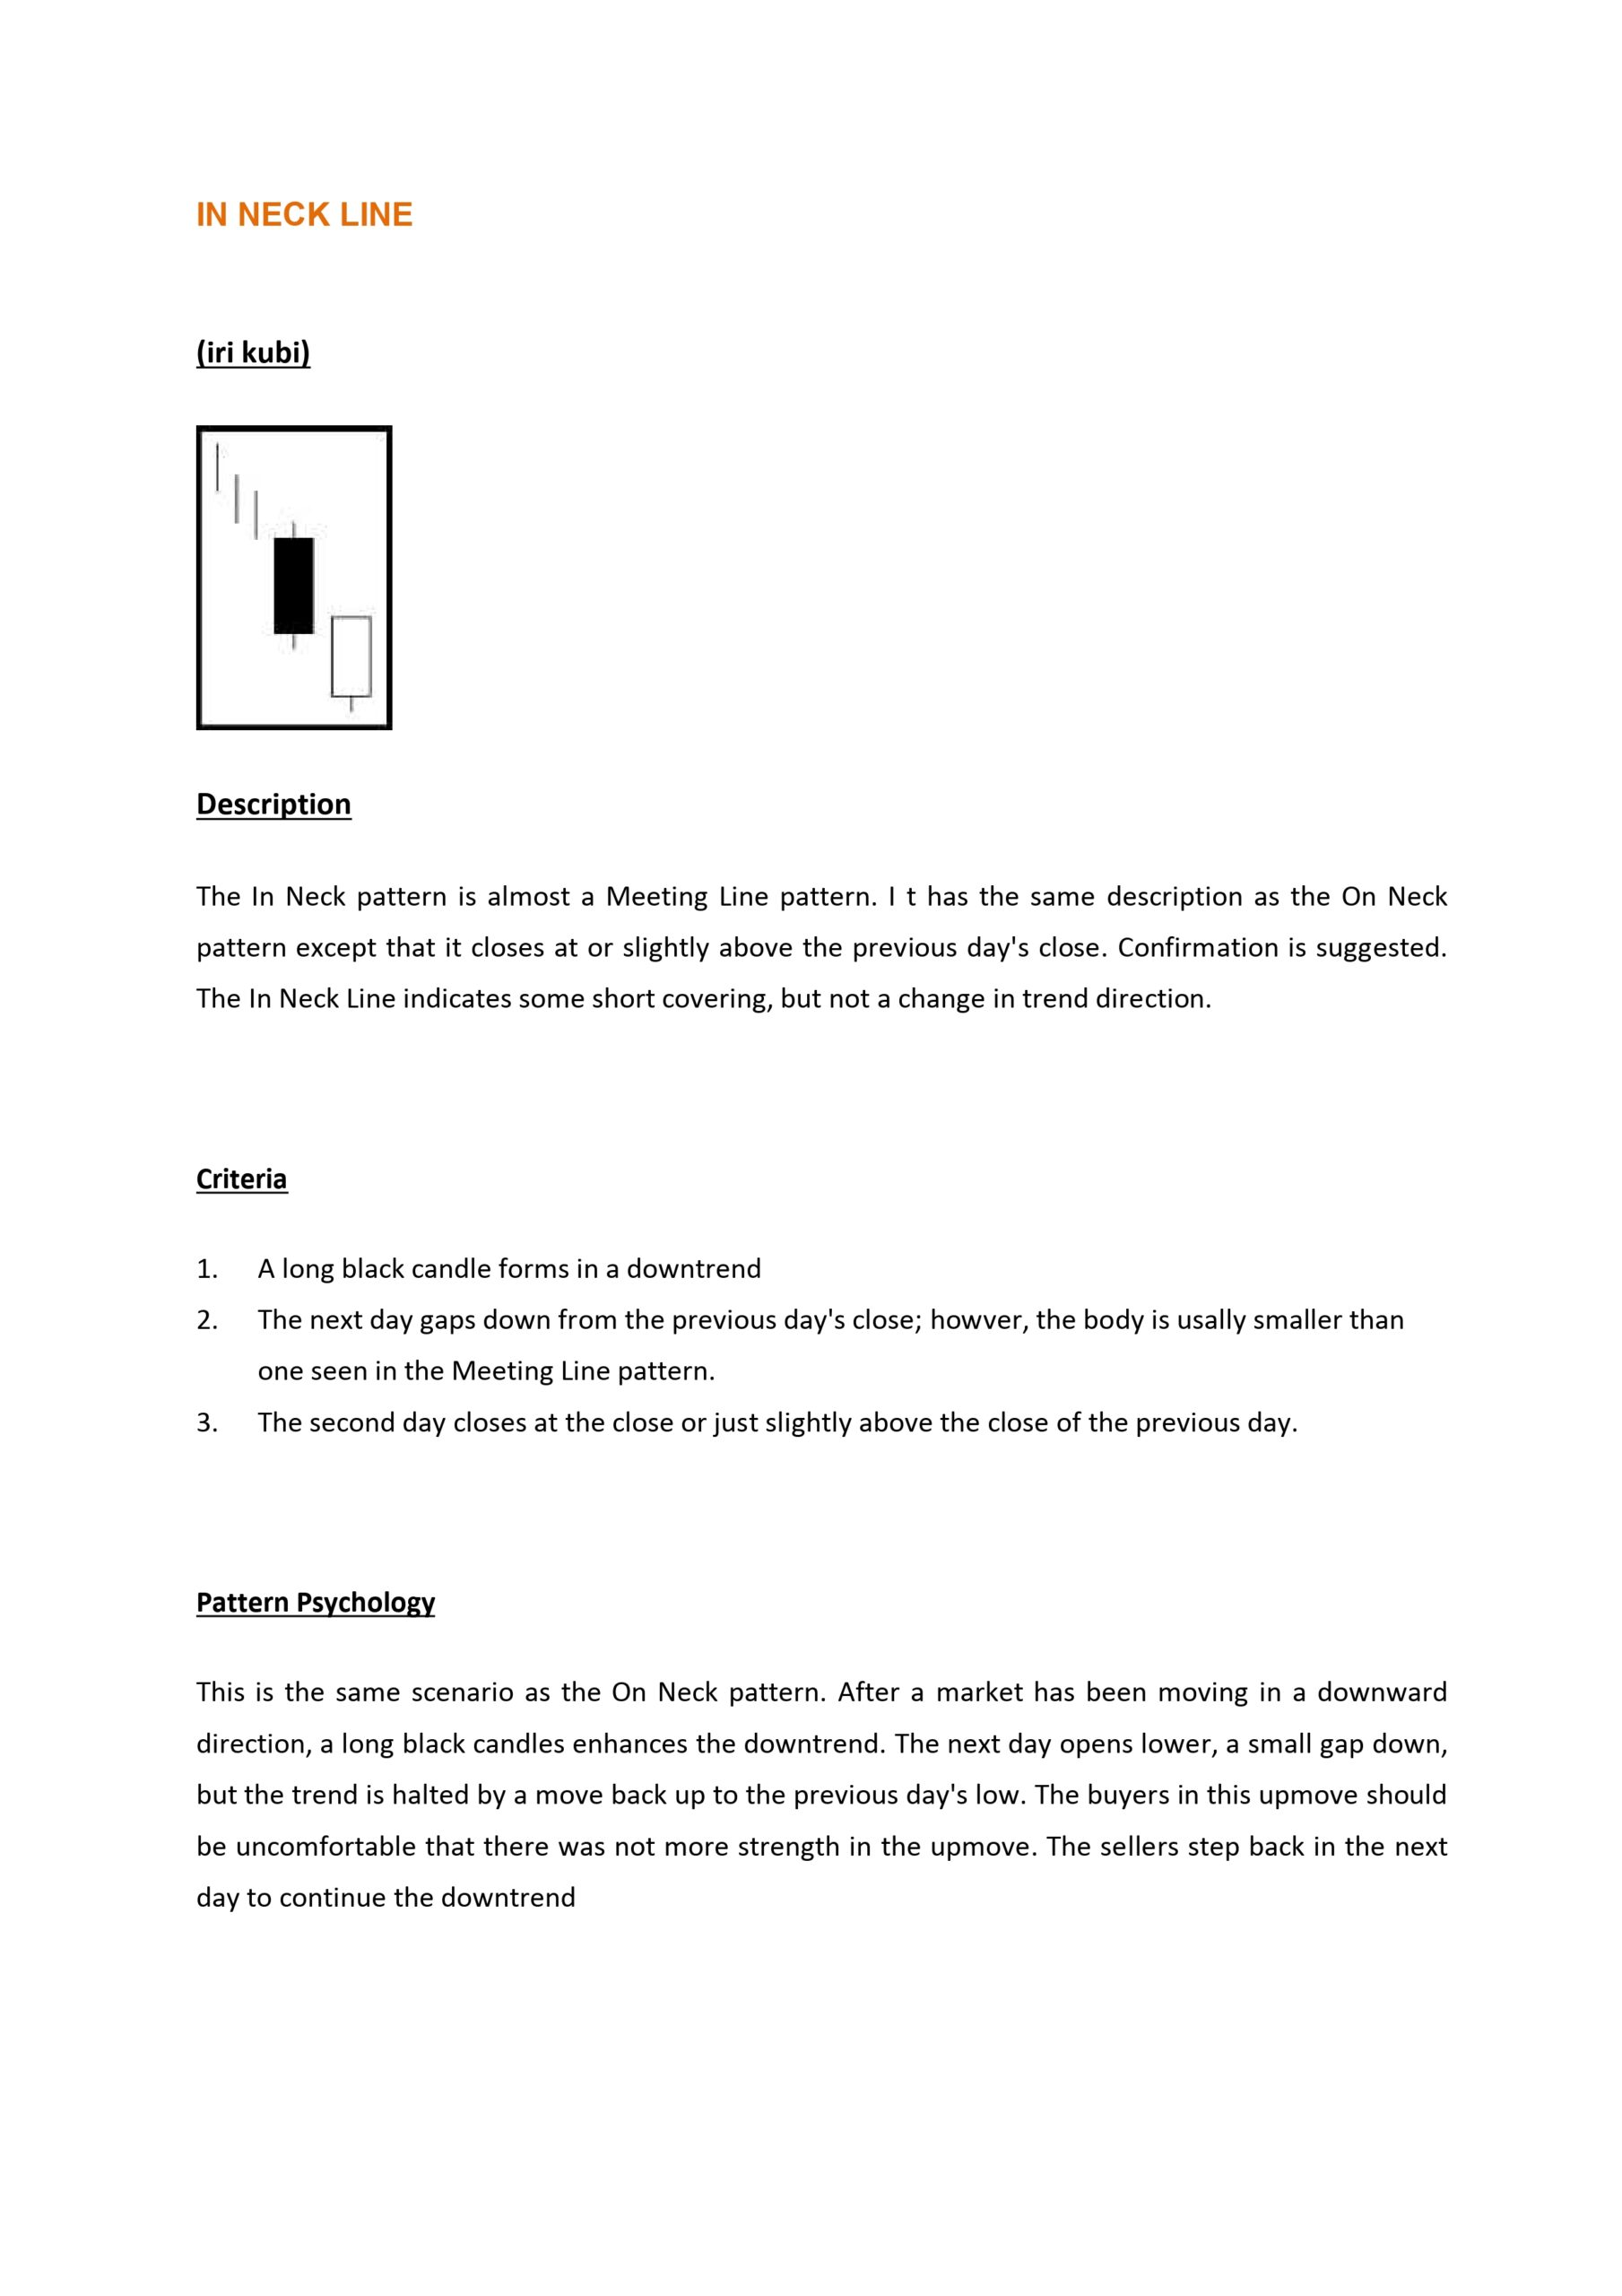
A bullish ladder bottom is a technical analysis pattern that can signal a potential reversal from a downtrend to an uptrend in the price of an asset. It is a rare and multi-candle pattern typically seen in stock trading. Here’s a breakdown of its characteristics:
Pattern Structure
- First Three Candles: The pattern starts with three consecutive bearish (down) candles, each one closing lower than the previous one, indicating a strong downtrend.
- Fourth Candle: The fourth candle is a doji (or a small-bodied candle), which suggests indecision or a potential reversal. This candle often opens with a gap down.
- Fifth Candle: The final candle in the pattern is a bullish (up) candle that closes above the fourth candle’s closing price, ideally closing above the body of the third candle as well.
Interpretation
- First Three Days: The initial three bearish candles confirm the existing downtrend, showing continuous selling pressure.
- Fourth Day: The doji or small-bodied candle indicates that selling pressure might be weakening, as the market is showing indecision.
- Fifth Day: The strong bullish candle suggests that buying interest is returning, signaling a potential trend reversal.
Trading Considerations
- Volume: Increased volume on the fourth and fifth days can add validity to the pattern, indicating stronger market conviction behind the reversal.
- Confirmation: Traders often look for additional confirmation of the trend reversal, such as breaking above a significant resistance level or additional bullish signals from other technical indicators.
- Risk Management: As with any trading pattern, it’s essential to use proper risk management techniques, such as setting stop-loss orders to protect against false signals.
Example
Imagine a stock that has been declining for several days:
- Day 1: Stock closes at $100 (down from $105 the previous day).
- Day 2: Stock closes at $95.
- Day 3: Stock closes at $90.
- Day 4: Stock closes almost unchanged at $89.5 with a doji formation.
- Day 5: Stock closes at $95 with a bullish candle, indicating a potential bottom and reversal.
In this scenario, the bullish ladder bottom pattern suggests that the downtrend might be ending and an uptrend could be beginning.
By recognizing this pattern, traders can potentially capitalize on the upcoming price reversal, entering long positions at advantageous prices. However, it is crucial to confirm the pattern with other technical analysis tools and indicators to reduce the risk of false signals.


