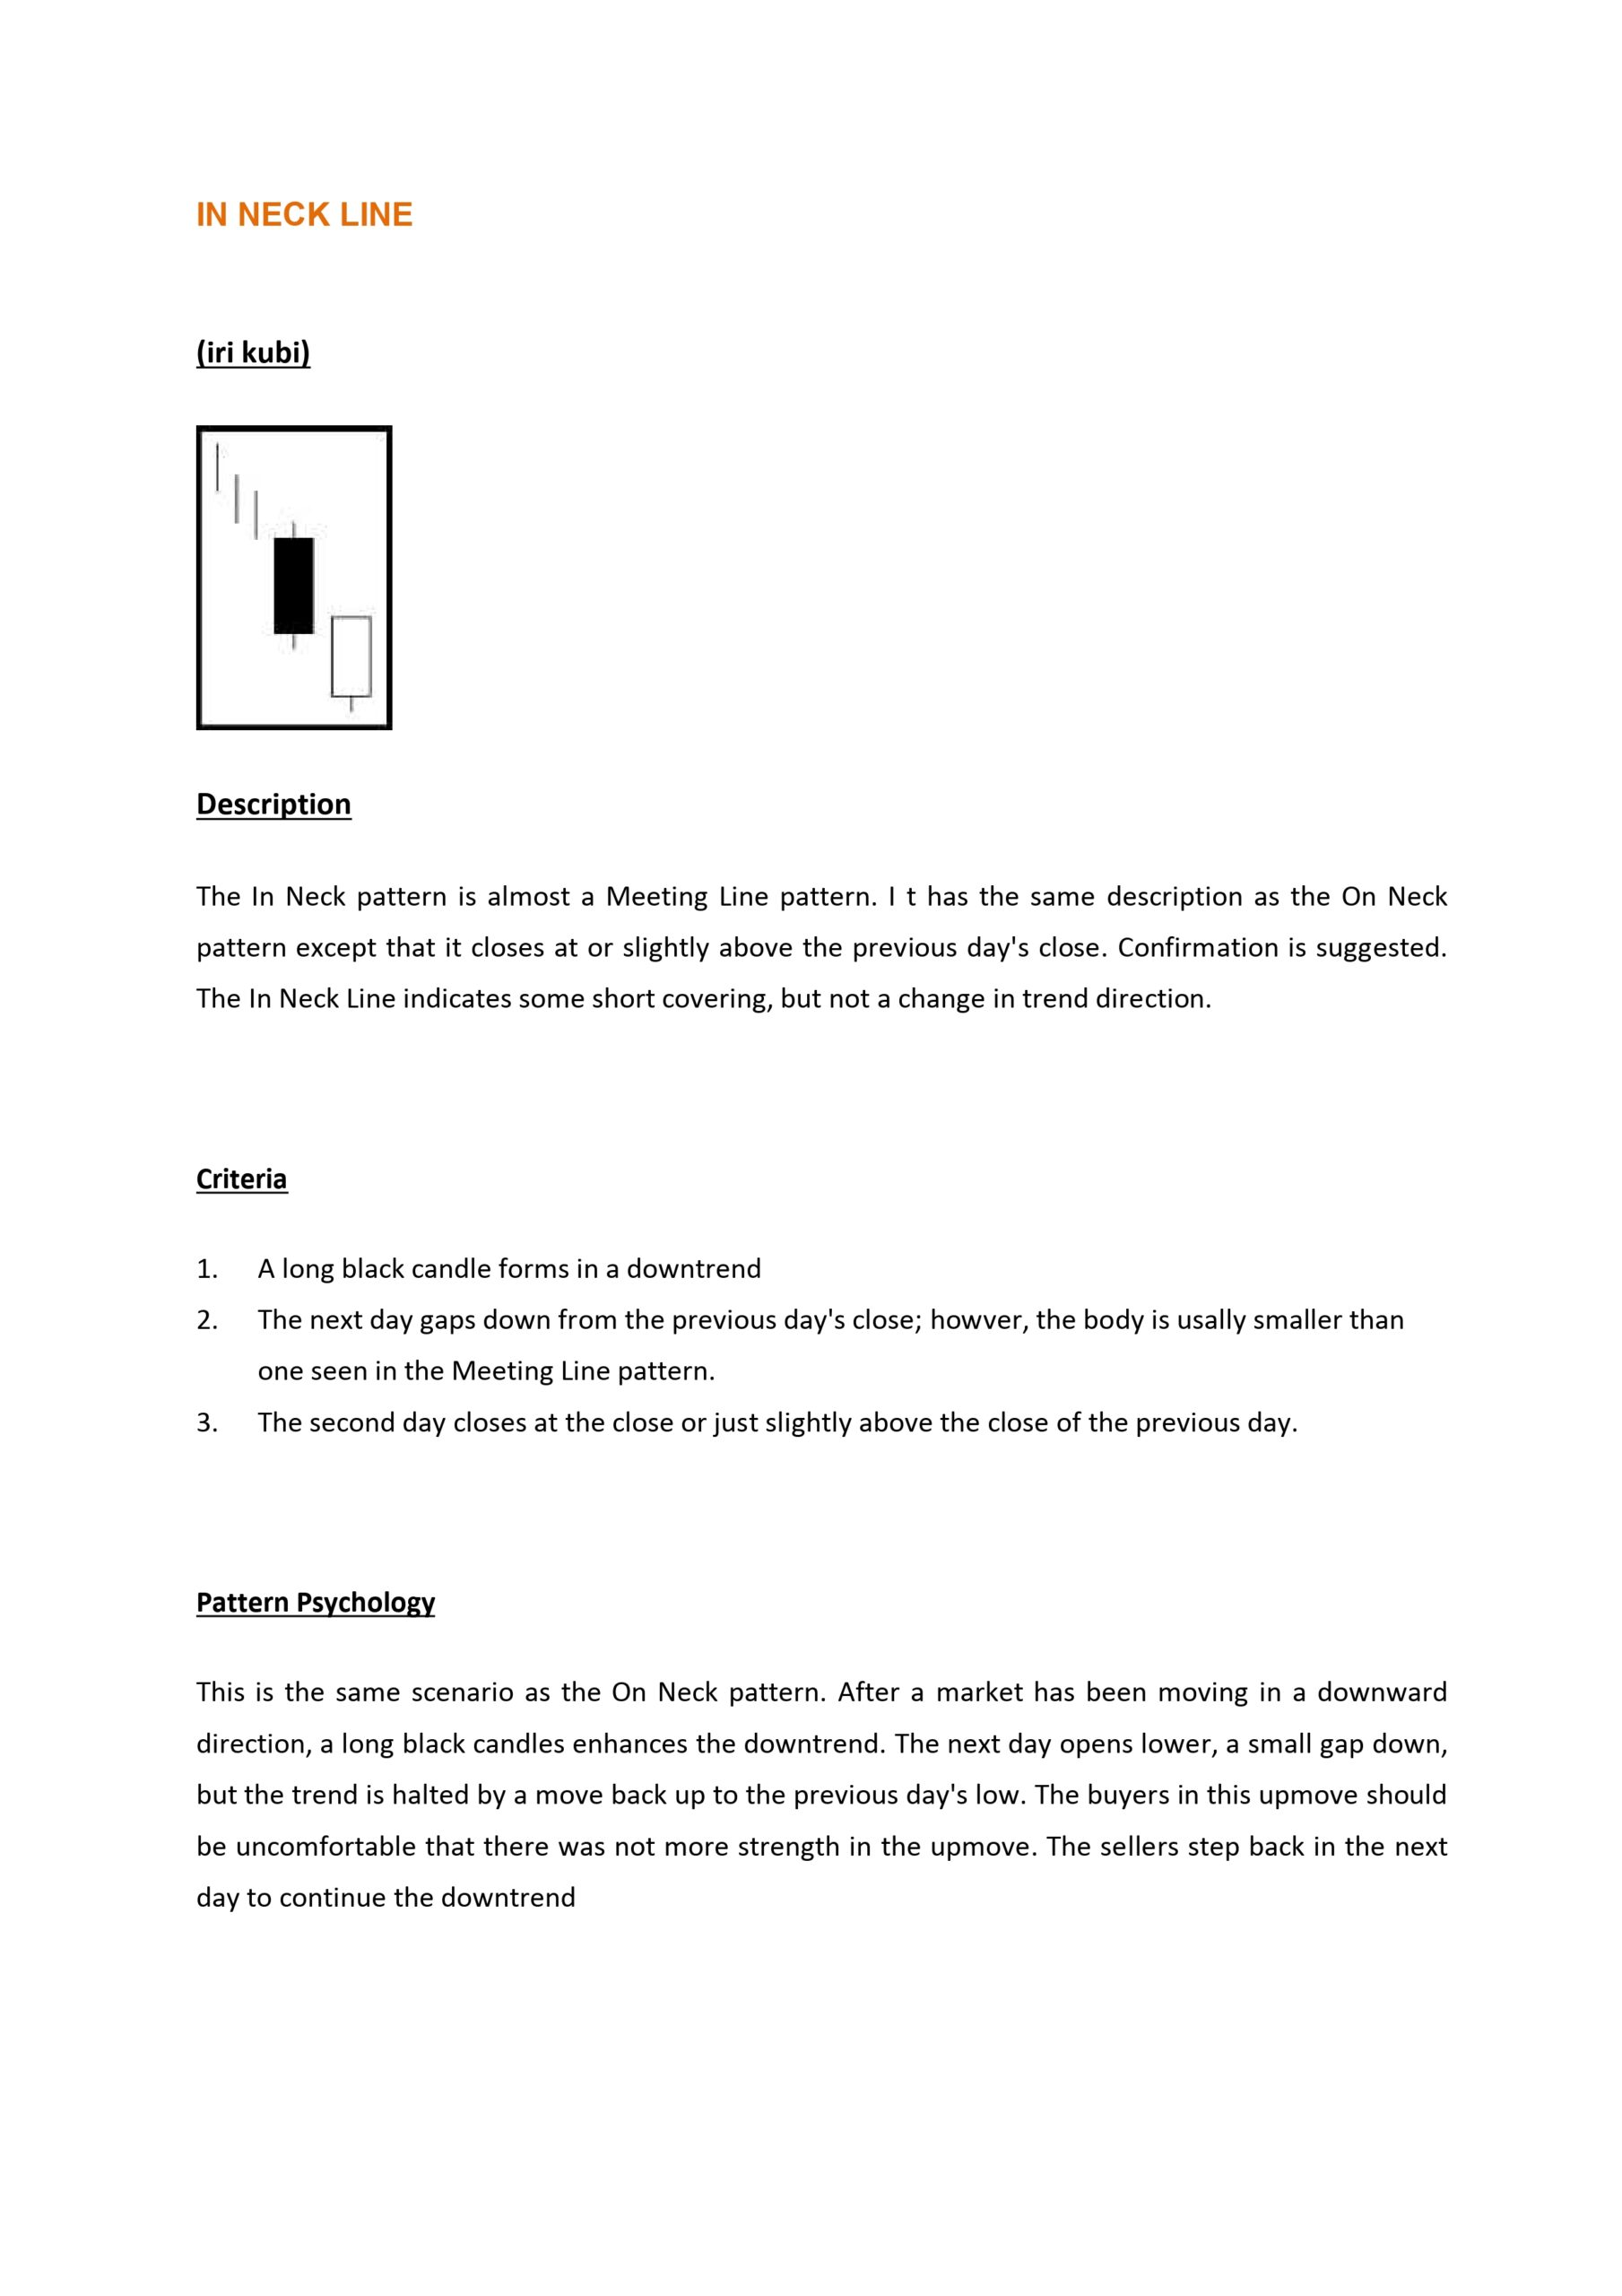
The “In Neck” candlestick pattern is a relatively rare and specific type of candlestick pattern used in technical analysis to signal potential reversals or continuation of trends. It primarily occurs in a downtrend and is a bullish continuation pattern. Here’s a breakdown of its key features and significance:
Characteristics of the In Neck Pattern
- Trend: Occurs during a downtrend.
- First Candle: A long bearish candle that indicates strong selling pressure.
- Second Candle: A smaller bullish candle that opens below the close of the first candle and closes near or slightly above the closing price of the first candle. The key point is that the second candle’s close is not above the first candle’s close.
- Color: Typically, the first candle is black or red (indicating bearishness), and the second candle is white or green (indicating bullishness).
Interpretation
- Bullish Continuation: Despite the bullish second candle, the pattern often signals a continuation of the downtrend. The inability of the bullish candle to close above the prior bearish candle’s close suggests that the selling pressure is still dominant.
- Psychology: The pattern indicates that while buyers tried to push the price up, they were unable to overcome the selling pressure, leading to a continuation of the downtrend.
Example
Consider a stock in a downtrend with the following price movements:
- First Day (Bearish Candle):
- Open: $50
- Close: $45
- Second Day (Bullish Candle):
- Open: $44
- Close: $45.50
Here, the second day’s bullish candle closes near the first day’s close but does not exceed it, forming an “In Neck” pattern.
Trading Strategy
While the In Neck pattern is often seen as a continuation pattern, it is essential to confirm it with other technical indicators or patterns. Traders might look for:
- Confirmation: Additional bearish signals such as a continuation of lower highs and lower lows or bearish volume patterns.
- Stop-Loss: Placing stop-loss orders above the high of the bullish candle to manage risk in case of an unexpected reversal.
- Entry Point: Considering short positions if the price continues to decline after the formation of the pattern.
Summary
The In Neck candlestick pattern is a useful tool for traders to identify potential continuations in a downtrend. However, it should be used in conjunction with other technical analysis tools to make more informed trading decisions. Understanding the market context and additional confirmation signals is crucial for effectively leveraging this pattern.
how does the In Neck pattern differ from the On Neck pattern
The In Neck pattern and the On Neck pattern are both bearish continuation patterns that occur during a downtrend. The main difference between the two patterns lies in the closing price of the second candle:
- In Neck Pattern: The second candle closes slightly higher than the prior candle’s close[2].
- On Neck Pattern: The second candle closes at or near the prior candle’s close, but not higher than its low[1][3][5].
In other words, the In Neck pattern shows a slightly stronger bullish attempt, while the On Neck pattern indicates a more significant failure of the bulls to push the price higher.
Citations:
[1] https://www.angelone.in/knowledge-center/online-share-trading/on-neck-candlestick-pattern
[2] https://www.babypips.com/forexpedia/in-neck
[3] https://www.investopedia.com/terms/n/neck-pattern.asp
[4] https://www.babypips.com/forexpedia/on-neck-pattern
[5] https://blog.elearnmarkets.com/on-neck-candlestick-pattern/
what are the key indicators to confirm an On Neck pattern
To confirm an On Neck pattern, traders typically look for additional indicators that support the continuation of the downtrend. Here are some key indicators to confirm the pattern:
- Volume: A decrease in trading volume during the formation of the On Neck pattern can indicate a lack of buying pressure, supporting the continuation of the downtrend[1][4].
- Momentum Indicators: A bearish crossover on the MACD (Moving Average Convergence Divergence) or the RSI (Relative Strength Index) dropping below 50 can confirm the downtrend and the On Neck pattern[4].
- Trend Confirmation: The price should continue to move lower after the On Neck pattern, indicating a strong downtrend. This can be confirmed by a series of lower highs and lower lows[1][4].
- Stop-Loss: Placing a stop-loss order above the high of the bullish candle can help manage risk in case of an unexpected reversal[2].
- Confirmation Candles: Waiting for additional bearish candles to form after the On Neck pattern can provide further confirmation of the downtrend[1][4].
- Technical Indicators: Combining the On Neck pattern with other technical indicators like moving averages or Bollinger Bands can enhance trading decisions and increase the probability of successful trades[2][4].
By considering these indicators, traders can increase the reliability of the On Neck pattern and make more informed trading decisions.
Citations:
[1] https://www.investopedia.com/terms/n/neck-pattern.asp
[2] https://fxopen.com/blog/en/how-to-trade-with-the-on-neck-pattern/
[3] https://www.tradingview.com/support/solutions/43000592722-on-neck-bearish/
[4] https://www.litefinance.org/blog/for-beginners/how-to-read-candlestick-chart/on-neck-pattern/
[5] https://www.angelone.in/knowledge-center/online-share-trading/on-neck-candlestick-pattern
how can I confirm a successful trade after identifying an On Neck pattern
To confirm a successful trade after identifying an On Neck pattern, look for the following:
- Confirmation Candles: Wait for additional bearish candles to form after the On Neck pattern, indicating the downtrend is continuing[1][4]. A drop below the low of the second candle in the On Neck pattern can be interpreted as confirmation of further downside[4].
- Volume: Look for increased trading volume on the confirmation candles, supporting the bearish momentum[1]. Higher volume on the downside move after the pattern suggests stronger selling pressure.
- Momentum Indicators: Observe bearish signals from momentum indicators like the MACD or RSI, such as a bearish crossover or the RSI dropping below 50[1][4]. This confirms the downward momentum.
- Support Levels: Monitor if the price breaks below key support levels, such as previous swing lows or moving averages[2][4]. A clean break of support levels validates the bearish continuation.
- Trend Continuation: Ensure the price continues to make lower highs and lower lows after the On Neck pattern, maintaining the overall downtrend[1][4]. A series of lower highs and lower lows confirms the bearish trend is intact.
- Stop-Loss Management: Adjust your stop-loss to just above the high of the On Neck pattern as the downtrend resumes[2][4]. Trailing the stop-loss helps lock in profits as the trade progresses.
By considering these factors, you can increase your confidence in the On Neck pattern’s validity and the likelihood of a successful trade. However, it’s essential to use the pattern in conjunction with other technical analysis tools and manage your risk appropriately.
Citations:
[1] https://www.litefinance.org/blog/for-beginners/how-to-read-candlestick-chart/on-neck-pattern/
[2] https://trendspider.com/learning-center/the-on-neck-and-in-neck-candlestick-patterns-a-traders-guide/
[3] https://fxopen.com/blog/en/how-to-trade-with-the-on-neck-pattern/
[4] https://www.investopedia.com/terms/n/neck-pattern.asp
[5] https://www.linkedin.com/pulse/trading-patterns-mastery-your-essential-pattern-guide-dhtac
what are the common pitfalls when trading the On Neck pattern
Here are some common pitfalls to avoid when trading the On Neck candlestick pattern:
- Premature entry: Entering a trade before the pattern fully materializes can lead to misjudged market signals and false entries[1]. It’s important to wait for the pattern to complete before considering a trade.
- Inadequate stop-loss placement: Setting stop-losses too close to the entry point doesn’t provide the trade enough room to develop. This increases the risk of an early exit from a potentially profitable move[1]. Place stops above the high of the second candle in the pattern.
- Lack of confirmation: Relying solely on the On Neck pattern without considering broader market conditions can result in misguided trades[1][2]. Look for additional confirmation from indicators like MACD, RSI, and subsequent price action to validate the pattern[2].
- Failure to manage risk: Not using proper risk management strategies, such as setting stop-losses and taking profits at key levels, can expose traders to excessive risk[4]. Manage risk by using appropriate position sizing and stop-loss orders.
- Over-trading: Taking on excessive risk by trading too many On Neck patterns can lead to poor results[4]. Be selective and focus on high-probability setups that align with the overall market context.
- Ignoring volume: Failing to analyze trading volume during the formation of the On Neck pattern can lead to incomplete analysis[2]. Look for decreased volume on the second candle to confirm the lack of buying pressure.
To avoid these pitfalls, traders should exercise patience, wait for confirmation, use proper risk management, and consider the broader market context when trading the On Neck pattern. Combining the pattern with other technical analysis tools can enhance the reliability of trading decisions.
Citations:
[1] https://www.quantifiedstrategies.com/bullish-in-neck-line/
[2] https://www.litefinance.org/blog/for-beginners/how-to-read-candlestick-chart/on-neck-pattern/
[3] https://trendspider.com/learning-center/the-on-neck-and-in-neck-candlestick-patterns-a-traders-guide/
[4] https://www.quantifiedstrategies.com/bearish-in-neck-line-candlestick-pattern/
[5] https://www.tradingview.com/support/solutions/43000592722-on-neck-bearish/


