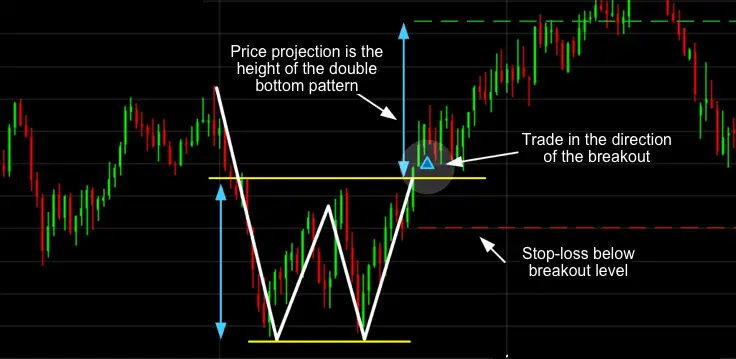
A V bottom pattern is a bullish reversal pattern characterized by a sharp downward movement followed by a quick reversal to the upside, forming a V shape on stock charts. This pattern typically occurs at the bottom of a downtrend and signals a potential trend reversal towards an upward movement. Key features of a V bottom pattern include a sharp dip in price, often forming a single candle with a long lower shadow, a steep downward movement, and a subsequent strong reversal to the upside. Traders usually look for a breakout at the top of the V to confirm the continuation of the pattern. Trading strategies for V bottom patterns involve entering a long position once the resistance level is broken, with a stop placed halfway down the right side of the V for risk management
what are other common reversal patterns in stock charts
Other common reversal patterns in stock charts include:
- Head and Shoulders Pattern: This pattern consists of a right shoulder, head, left shoulder, and neckline. It typically signals a new bearish trend when formed during an uptrend.
- Wedges: Wedge patterns can be rising or falling and are drawn by connecting key resistance and support levels. A rising wedge often leads to a bearish breakout, while a falling wedge leads to a bullish breakout.
- Double Top: This pattern forms during an uptrend when the price rises to a resistance level, retreats briefly, then rises again to test the resistance level. It indicates a potential bearish breakout.
- Symmetrical Triangle: This pattern can lead to a breakout in either direction and is not a perfect reversal pattern. It is one of the three types of triangle patterns along with ascending and descending triangles.
- Triple Top: Similar to a double top, the triple top pattern involves the price rising to a resistance level, retreating to a support level, rising again to retest the resistance, and then sharply moving lower, signaling a potential bearish reversal
V bottom pattern in Reversal Patterns
The V bottom pattern in reversal patterns is a bullish pattern characterized by a sharp downward movement followed by a quick and strong reversal to the upside, forming a V shape on stock charts. This pattern typically occurs at the bottom of a downtrend and signals a potential trend reversal towards an upward movement.
Key features of a V bottom pattern include a sharp dip in price, often forming a single candle with a long lower shadow, a steep downward movement, and a subsequent strong reversal to the upside. Traders usually look for a breakout at the top of the V to confirm the continuation of the pattern. The V bottom pattern is known for its reversal potential and often appears in a channel, with the upward trend likely to continue once the pattern is complete.
what is the difference between a v bottom and a v top pattern
The difference between a V bottom and a V top pattern lies in their directional implications and the market conditions in which they typically occur:
- V Bottom Pattern:
- Direction: A V bottom pattern is a bullish reversal pattern that forms at the bottom of a downtrend, signaling a potential trend reversal towards an upward movement.
- Formation: It is characterized by a sharp downward movement followed by a quick and strong reversal to the upside, forming a V shape on stock charts.
- Identification: Traders look for a breakout at the top of the V to confirm the continuation of the pattern, entering long positions once the neckline is breached.
- V Top Pattern:
- Direction: In contrast, a V top pattern is a bearish reversal pattern that occurs at the top of an uptrend, indicating a potential trend reversal towards a downward movement.
- Formation: It involves a sharp upward movement followed by a rapid reversal to the downside, forming an inverted V shape on stock charts.
- Identification: Traders typically wait for a breakdown below the bottom of the V to confirm the pattern, considering short positions once the neckline is breached.
While both patterns exhibit a V shape, the key distinction lies in their implications for market direction, with V bottoms signaling a shift from bearish to bullish sentiment, and V tops indicating a shift from bullish to bearish sentiment


