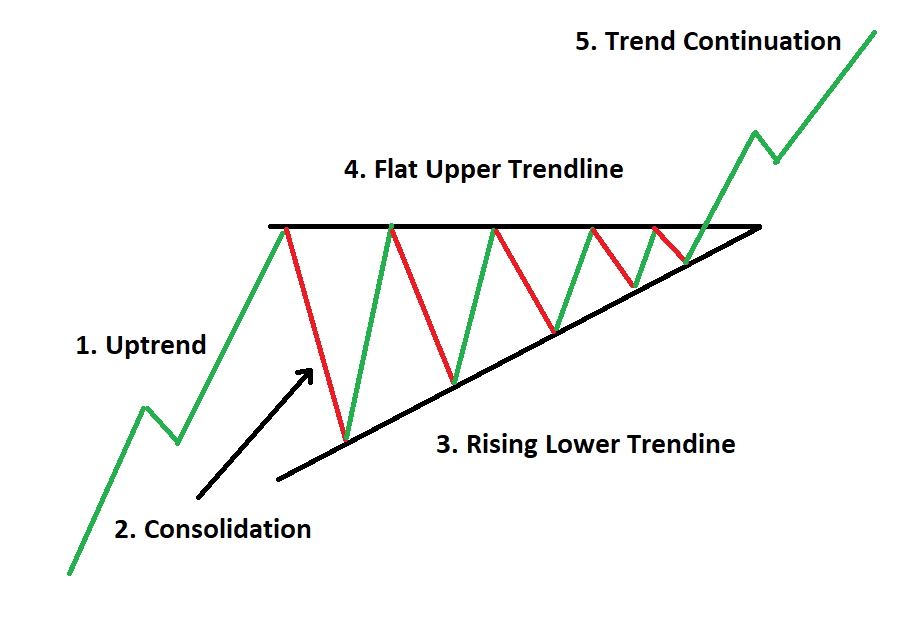
An ascending triangle is a bullish continuation pattern in technical analysis. This pattern typically occurs within an uptrend and signals a potential bullish breakout above a resistance level. It is characterized by a horizontal resistance line and a rising trend line, with the price oscillating between testing the resistance area and forming consecutively higher lows.
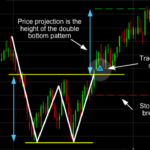
Traders often look for a breakout above the resistance area, accompanied by increased volume, to confirm the pattern. The profit target for an ascending triangle breakout is usually calculated by adding the price difference at the widest part of the triangle to the breakout point. Setting a stop loss slightly below the horizontal resistance line can help manage risk in case the breakout fails
what are the characteristics of an ascending triangle pattern
The characteristics of an ascending triangle pattern include:
- Formation: An ascending triangle is formed by two converging trendlines: a horizontal resistance line and a rising support line. The horizontal line connects at least two swing highs, while the rising line connects at least two swing lows, creating a triangle shape123.
- Continuation Pattern: It is classified as a continuation pattern, indicating a potential continuation of the prevailing trend. If the pattern forms during an uptrend, the price is likely to continue upward after the breakout13.
- Bullish and Bearish Signals: Ascending triangles are often considered bullish patterns, signaling a potential bullish continuation if formed during an uptrend. However, they can also indicate bearish reversals if formed during a downtrend, suggesting a potential downside breakout13.
- Identification: Traders look for specific criteria to identify an ascending triangle pattern, including two or more swing highs connected by a horizontal resistance line, two or more swing lows connected by a rising support line, and multiple touches of both trendlines for greater reliability12.
- Trading Strategies: Once identified, traders watch for a breakout in either direction. They enter a long trade if the price breaks above the horizontal resistance line and a short trade if it breaks below the rising support line. Setting a stop-loss order just outside the opposite side of the pattern and calculating a profit target based on the height of the triangle added or subtracted from the breakout point are common strategies12.
These characteristics help traders recognize, interpret, and trade the ascending triangle pattern effectively in technical analysis.
what is the difference between an ascending triangle and a descending triangle pattern
The difference between an ascending triangle and a descending triangle pattern lies in their formations, implications, and market sentiment:
- Formation:
- Ascending Triangle: Formed in an uptrend, the ascending triangle consists of a horizontal resistance line and a rising support line. The resistance level remains flat, while the support line slopes upwards, creating a triangle shape.
- Descending Triangle: In contrast, the descending triangle is formed in a downtrend with a horizontal support line and a downward-sloping resistance line. The support level remains flat, while the resistance line slopes downwards, shaping a triangle pattern34.
- Implications:
- Ascending Triangle: Typically signals a bullish continuation pattern, suggesting that the price is likely to break out above the resistance level and continue to rise, reflecting bullish sentiment23.
- Descending Triangle: Indicates a bearish continuation pattern, where the price is expected to break out below the support level and continue to fall, reflecting bearish sentiment23.
- Market Sentiment:
Understanding these differences is crucial for traders as they analyze chart patterns, identify potential entry and exit points, and make informed trading decisions based on the specific characteristics and implications of ascending and descending triangle patterns.