A descending triangle is a bearish continuation pattern in technical analysis that typically forms during a downtrend. This pattern consists of a horizontal lower trendline acting as support and a descending upper trendline acting as resistance. Traders identify a descending triangle by observing lower highs being formed along the upper trendline and a horizontal support level.
The breakout from a descending triangle usually occurs to the downside, indicating a potential continuation of the bearish trend. However, it’s important to note that descending triangles can also act as reversal patterns if there is a breakout in the opposite direction. Traders often watch for volume trends and price action to confirm the breakout direction,
what are some other continuation patterns in technical analysis
In addition to the descending triangle, other continuation patterns in technical analysis include:
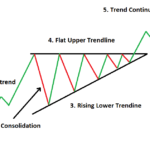
- Ascending Triangle: This is a bullish continuation pattern where prices have seen a near-vertical rise. The pattern forms when a flat resistance trendline converges with a rising support trendline. A breakout occurs when the price breaks the resistance trendline, and the price target is calculated by adding the triangle’s height at its thickest point to the breakout point4.
- Bullish Pennant: Bullish pennants are continuation patterns that appear in a strong uptrend. They consist of a flagpole followed by a period of consolidation. The bullish trend is expected to resume after a breakout from the resistance trendline, with the price target calculated by measuring the length of the flagpole and projecting it from the breakout point4.
- Bullish Flag: The bullish flag pattern is characterized by a downward sloping channel denoted by two parallel trendlines against the preceding trend. It provides a temporary respite to a sharp initial move, with explosive moves often associated with it. Traders can enter a trade when the price breaks the resistance trendline, and the price target is calculated based on the height of the flagpole24.
- Bullish Rectangle Pattern: This pattern signifies a pause in the trend where price moves sideways between parallel support and resistance levels. It indicates consolidation before continuing in the original trend direction. Traders can trade within the range or wait for an eventual breakout, with the price target calculated based on the height of the pattern24.
These patterns, along with the descending triangle, are essential tools in technical analysis for identifying potential trading opportunities based on the continuation of existing trends.
what are some examples of reversal patterns in technical analysis
Examples of reversal patterns in technical analysis include:
- Head and Shoulders Pattern: This pattern consists of three peaks, with the middle peak (the head) being higher than the other two (the shoulders). It signals a reversal from an uptrend to a downtrend. Traders look for a short entry when the price breaks below the neckline and place a stop-loss above the right shoulder34.
- Double Top and Double Bottom: The double top pattern occurs after a significant uptrend, with two peaks at the same height indicating a potential reversal. Conversely, the double bottom pattern appears after a downtrend, with two bottoms at the same level suggesting a reversal opportunity. Traders wait for a breakout of the trigger line to enter a trade34.
- Rounding Top and Rounding Bottom: These patterns involve a gradual and smooth curve at the end of an uptrend or downtrend, signaling a potential reversal. Traders can enter a trade when the price breaks below the support level for a rounding top or above the resistance level for a rounding bottom, placing a stop-loss accordingly3.
- Cup and Handle Pattern: This pattern features a U-shaped curve followed by a smaller downward-sloping curve, indicating a reversal from a downtrend to an uptrend. Traders enter a long position when the price breaks above the resistance level and place a stop-loss below the handle3.
- Quasimodo Pattern: The Quasimodo pattern is a reliable chart pattern that identifies reversal opportunities after a significant uptrend or downtrend. It involves a change in momentum indicated by a new high or low. Traders can enter a trade at the last peak or bottom, depending on the direction of the pattern4.
These examples highlight different reversal patterns that traders use in technical analysis to identify potential changes in price direction and make informed trading decisions.