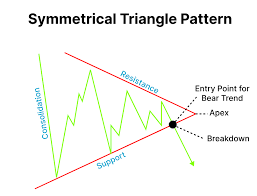
A bearish symmetrical triangle is a chart pattern that typically forms during a downtrend and is considered a bearish signal. This pattern is characterized by two converging trend lines that connect a series of lower highs and higher lows. The symmetrical triangle indicates a period of consolidation before a potential breakdown. In this pattern, the lower trendline represents support, showing that buyers are outpacing sellers, causing the stock’s price to rise. The upper trendline represents the overbought side of the market.When trading a bearish symmetrical triangle, traders should wait for the price action to break through the lower trendline with increased volume, signaling a potential downward move.
The breakout to the downside is significant, and volume plays a crucial role in confirming this breakout. Some analysts believe that volume strength is paramount in these situations. The development of a descending triangle takes a similar amount of time as an ascending triangle, typically about four weeks to form and not lasting more than 90 days.To enter a trade based on a bearish symmetrical triangle, traders often wait for the price action to break below the lower trendline and may consider retesting the broken trendline for a better entry point. It’s essential to monitor the breakout carefully and consider using other technical indicators and chart patterns in conjunction with the symmetrical triangle for a more comprehensive analysis.
what are the characteristics of a bearish symmetrical triangle
A bearish symmetrical triangle is a bearish continuation chart pattern characterized by two converging trend lines that are symmetrical in relation to the horizontal line. The first line is a bearish trend line creating the resistance, also known as the “resistance line of the bearish symmetrical triangle.” The second line is a bullish trend line creating the support, also referred to as the “support line of the bearish symmetrical triangle.” For a symmetrical triangle to be considered “bearish,” the movement preceding the triangle’s formation must be bearish.
The pattern is confirmed if there is good oscillation between the two lines, with each line being touched at least twice to validate the pattern. The price objective for a bearish symmetrical triangle is determined by the height of the base of the triangle plotted at the breakout point. Additionally, a bearish symmetrical triangle is considered valid if the price touches the support line at least 3 times and the resistance line twice (or vice versa). The exit from a bearish symmetrical triangle is typically bearish in 57% of cases, with the downward movement often continuing after exiting the triangle. It is essential to note that the bearish symmetrical triangle is a continuation chart pattern, and its exit usually occurs at about 80% of the pattern. Clean and forceful breaks/exits tend to give better performance, especially when the pattern is formed at the beginning of a bearish trend.
what is the difference between a bearish and bullish symmetrical triangle
The difference between a bearish and bullish symmetrical triangle lies in the direction of the preceding trend and the implications for future price movements:
- Bearish Symmetrical Triangle:
- Preceding Trend: A bearish symmetrical triangle forms after a bearish trend, indicating a period of consolidation before a potential continuation of the downtrend.
- Characteristics: It consists of two converging trend lines, with the lower trend line acting as support and the upper trend line as resistance.
- Validation: The price should touch the support line at least three times and the resistance line twice to confirm the pattern.
- Price Objective: The price objective is determined by the height of the base of the triangle plotted at the breakout point.
- Exit and Performance: In 57% of cases, the exit from a bearish symmetrical triangle is bearish, with the downward movement often continuing after the breakout. The exit typically occurs at about 80% of the pattern.
- Bullish Symmetrical Triangle:
- Preceding Trend: A bullish symmetrical triangle forms after a bullish trend, indicating a consolidation phase before a potential continuation of the uptrend.
- Characteristics: Similar to the bearish pattern, it consists of two converging trend lines, with the upper trend line as resistance and the lower trend line as support.
- Validation: The price should touch the support line at least three times to confirm the pattern.
- Price Objective: The price target is determined by the height of the base of the triangle plotted at the breakout point.
- Exit and Performance: In 63% of cases, the exit from a bullish symmetrical triangle is bullish, with the upward movement often continuing after the breakout. The exit typically occurs at about 80% of the pattern.
In summary, the key distinction between a bearish and bullish symmetrical triangle is the direction of the preceding trend, with the bearish pattern forming after a downtrend and the bullish pattern forming after an uptrend. The implications for future price movements are also different, with bearish triangles signaling a potential continuation of a downtrend and bullish triangles indicating a potential continuation of an uptrend.