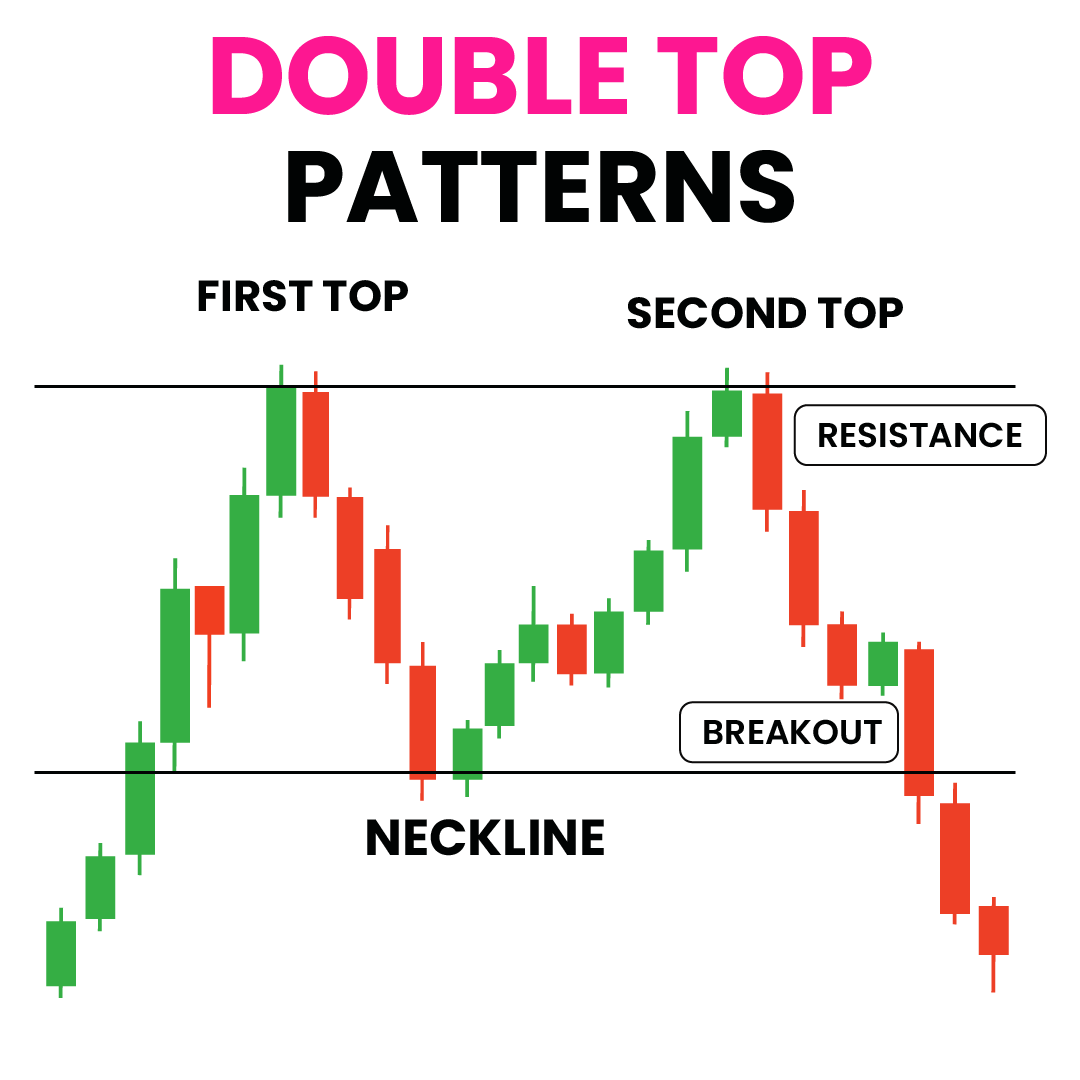
How to identify a double top pattern on a chart
To identify a double top pattern on a chart, follow these key steps:
- Chart Analysis:
- Peak Characteristics:
- Neckline Confirmation:
- The neckline is formed between the price low of the valley between the two peaks.
- A break below this neckline confirms the double top pattern and signals a bearish reversal2.
- Volume Confirmation:
- Additional Indicators:
- Use other technical indicators like moving averages and oscillators to support the bearish signal from the double top pattern.
- Look for signs of slowing momentum, such as lagging peaks on oscillators like RSI2.
By following these steps and paying attention to the specific characteristics of double top patterns on a chart, traders can effectively identify this bearish reversal pattern and make informed trading decisions based on its signals.
what are some common mistakes to avoid when identifying double top patterns
When identifying double top patterns, it is crucial to avoid common mistakes to ensure accurate recognition and effective trading decisions. Here are some common mistakes to avoid:
- Failing to Confirm the Pattern:
- Ignoring Volume Analysis:
- Disregarding Support and Resistance Levels:
- Support and resistance levels play a significant role in trading double top patterns. Ignoring these levels can result in entering trades with weak confirmation signals or failing to identify potential reversals accurately3.
- Setting Unrealistic Targets:
- Failing to Use Stop Loss:
- Overlooking Confirmation from Other Indicators:
By avoiding these common mistakes and conducting thorough analysis while identifying double top patterns, traders can enhance their ability to recognize these bearish reversal patterns accurately and make informed trading decisions.
What are some common indicators used to confirm double top patterns
Common indicators used to confirm double top patterns include: By utilizing these indicators in conjunction with chart analysis, traders can enhance their ability to confirm double top patterns accurately and make informed trading decisions based on these bearish reversal signals
- Moving Averages:
- Moving averages help identify trends in the market and can confirm double top patterns. Traders look for the price bouncing off the resistance level twice before dropping below the moving average to validate the pattern
- RSI is a useful tool for confirming double top patterns by measuring the strength of a trend. Traders observe if the RSI forms a similar pattern to the price, such as two peaks, to confirm the potential trend reversal indicated by the double top pattern
- Volume plays a crucial role in confirming double top patterns. High volume during the pattern formation indicates a strong trend continuation, while low volume may suggest a false signal and potential reversal
- Fibonacci retracement levels help identify potential support and resistance levels. Traders watch for price behavior around these levels to confirm double top patterns, looking for price bouncing off resistance before dropping below key retracement levels
- Oscillators like MACD can confirm double top patterns by showing bearish divergences when the pattern is forming. Traders look for signals like bearish divergences to support the likelihood of a price drop following a double top formation
how to use volume analysis to confirm double top patterns
To use volume analysis to confirm double top patterns, traders can follow these key steps based on the information from the provided sources: By incorporating these volume analysis techniques, traders can effectively confirm double top patterns and make informed trading decisions based on the signals provided by volume movem
- Compare Volume Levels:
- Compare the volume accompanying the formation of the first peak with the volume during subsequent price movements. Look for a decrease in volume as the pattern develops, indicating a potential reversal
- Watch for Volume Spikes:
- Pay attention to significant spikes in volume during the formation of the pattern or the breakout. These spikes can indicate increased market activity and provide additional confirmation for the pattern’s validity
- Utilize Multiple Timeframes:
- Analyzing volume across different timeframes can offer a more comprehensive view of market sentiment. Confirming volume patterns on multiple timeframes can enhance the reliability of the analysis
- Volume Trend Analysis:
- During the formation of a double top pattern, observe whether the volume is decreasing or increasing. A decrease in volume suggests a lack of conviction from market participants, potentially indicating a weaker reversal signal. Conversely, an increase in volume can indicate stronger selling pressure, reinforcing the pattern’s validity
- Volume at Breakout Point:
- When the price breaks below the neckline of the double top pattern, observe whether the volume increases significantly. A surge in volume during the breakout indicates strong selling pressure and validates the pattern