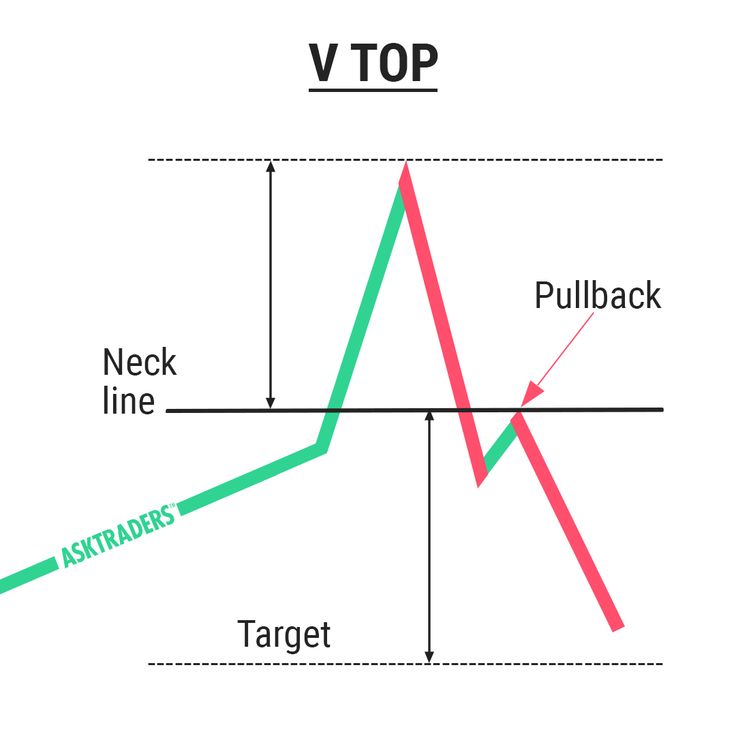
A V top is a chart pattern characterized by a sharp, inverted V-shaped peak that signals a potential trend reversal in the market. This pattern typically occurs after a strong upward movement, indicating a possible change in direction. Key features of a V top include a sharp peak formed by a single candlestick, a steep bullish trend line driving the upward movement, and a subsequent bearish reversal with an angle similar to the initial bullish trend.
Traders can use different strategies when trading V tops, such as opening short positions at the break of the neckline for a traditional approach or opening long positions if the bearish line angle matches the bullish line angle for a more aggressive strategy. It is important to note that V tops are challenging to anticipate, but they can offer significant opportunities for traders to capitalize on trend reversals in the market.
what is the difference between a v top and a double top
A V top and a double top are both chart patterns that signal potential trend reversals in the market, but they have distinct characteristics:
V Top:
- Shape: V tops are characterized by a sharp, inverted V-shaped peak.
- Formation: They typically occur after a strong upward movement, indicating a potential reversal from an uptrend to a downtrend.
- Key Features: A single candlestick forms the sharp peak, followed by a bearish reversal with an angle similar to the initial bullish trend.
- Trading Strategy: Traders can open short positions at the break of the neckline for a traditional approach or long positions if the bearish line angle matches the bullish line angle.
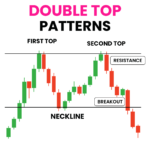
Double Top:
- Shape: Double tops consist of two peaks that reach a similar price level, separated by a temporary pullback forming a “valley” or “neckline.”
- Formation: This pattern occurs when an asset’s price reaches a peak, experiences a temporary pullback, rallies to reach a similar peak, and then reverses its trend.
- Key Features: The duration between the two peaks can vary, typically ranging from weeks to months. Traders use trendlines to connect the peaks and neckline for visual representation.
- Trading Strategy: Traders often look for a decline in trading volume during the pullback phase as an indication of potential exhaustion of the uptrend. They may use additional technical indicators like RSI or MACD for confirmation.
In summary, while both patterns indicate potential trend reversals, a V top is characterized by a sharp V-shaped peak after an uptrend, whereas a double top consists of two peaks separated by a pullback before reversing the trend. Traders employ different strategies based on the unique features of each pattern to anticipate and capitalize on market movements effectively.
how to trade a v top pattern
To trade a V top pattern effectively, traders can follow these key strategies based on the information provided in the sources:
- Identification: Recognize a V top pattern by observing a sharp, inverted V-shaped peak after a strong upward movement, indicating a potential trend reversal from bullish to bearish.
- Confirmation: Wait for price to break below the neckline of the pattern, signaling a potential entry point for a short position. Look for a retest of the neckline before entering the trade, but be cautious as the sell-off can be swift without a retest.
- Trading Strategy:
- Conservative Approach: Wait for a break and close below the neckline, then attempt a short position once price pulls back to the neckline and gets rejected.
- Target Setting: Set an ideal target below the price by measuring the same distance from the top of the pattern to the neckline low.
- Volume and Momentum: Monitor volume and momentum during the upswing and immediate downswing for early indications of a V top pattern taking place.
- Market Influences: Be aware that certain markets, like Crude Oil, can be influenced by geopolitical events, leading to the formation of V-shaped patterns.
- Risk Management: Consider using stop-loss orders to manage risk and protect against adverse price movements.
- Patience and Caution: Trading V tops can be challenging as the pattern is often recognized after the neckline break. Therefore, it is crucial to keep an eye on momentum, volume, and price behavior to anticipate and react to these patterns effectively.
By following these guidelines, traders can navigate the complexities of V top patterns and potentially capitalize on trend reversals in the market