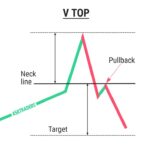
A diamond top reversal pattern is a technical analysis pattern that typically forms at the end of an uptrend, signaling a potential reversal to a downtrend. This pattern resembles an off-center head and shoulders pattern or a flattened double top pattern.
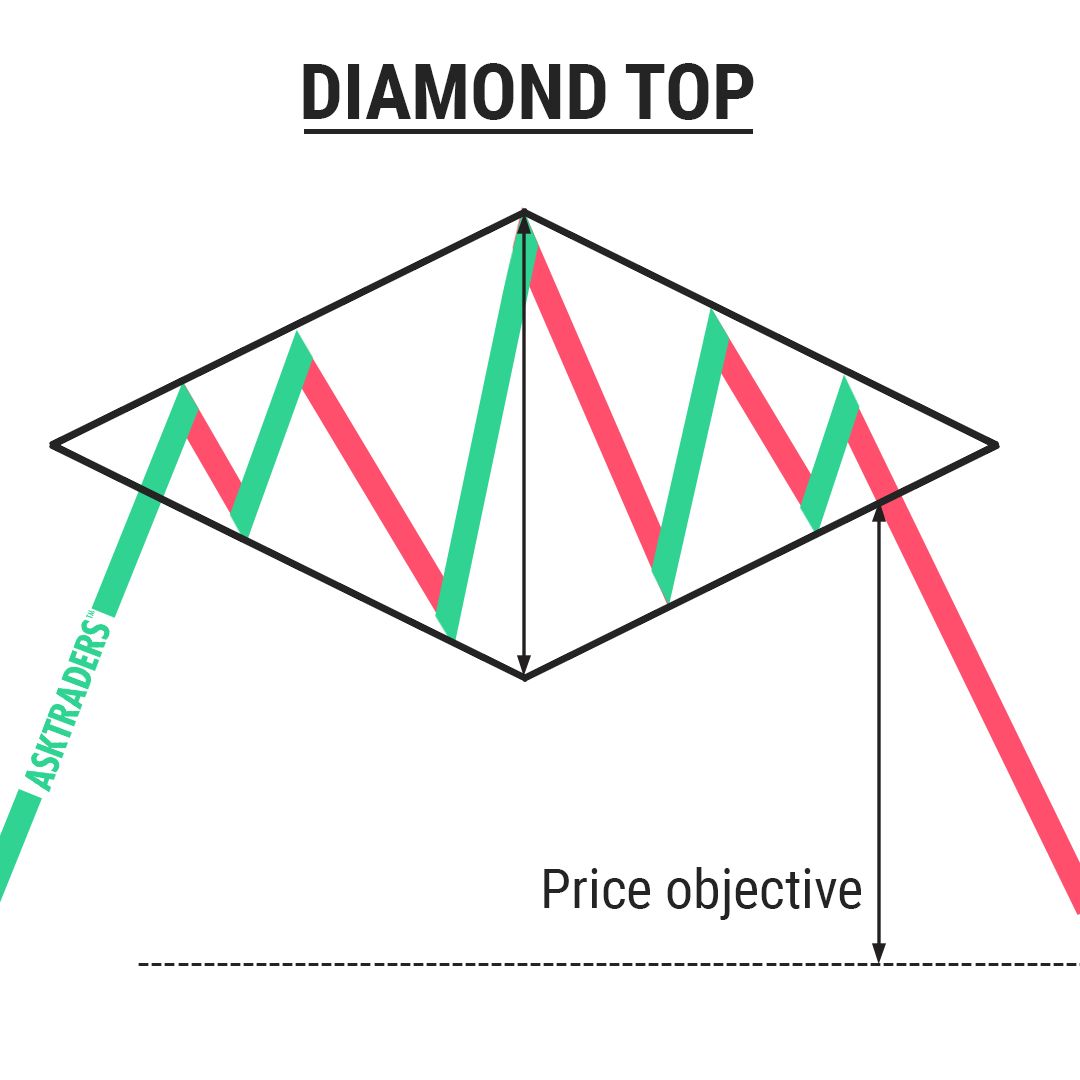
Traders identify a diamond top by drawing trend lines around the pattern to form a diamond shape. The price action must remain within these trend line boundaries for it to be classified as a diamond top. When the price breaks below the lower trend line of the diamond, it confirms the reversal, providing traders with a signal to potentially sell or short sell to profit from the new downtrend formation.
What are the key characteristics of a diamond top reversal pattern.
The key characteristics of a diamond top reversal pattern include the following:
- Formation: The diamond top pattern typically forms at market tops and signals a potential reversal of an uptrend. It resembles a diamond shape on the chart, with a series of lower highs and higher lows12.
- Breakout: A bearish signal occurs when the price decisively breaks below the lower trendline of the diamond, confirming the reversal from an uptrend to a downtrend2.
- Implication: Traders interpret a Diamond Top as a cue to consider short-selling or exiting long positions, anticipating a shift from an uptrend to a downtrend2.
- Visual Appearance: The pattern looks like an off-center head and shoulders pattern or a flattened double top pattern, forming a diamond shape on the chart1.
- Trading Strategy: When trading a diamond top pattern, traders wait for a clear breakout below the lower trendline, consider short-selling or exiting long positions, set stop-loss orders above recent swing highs, determine target prices based on the width of the pattern, and use proper risk management techniques24.
These characteristics help traders identify and trade the diamond top reversal pattern effectively to capitalize on potential trend reversals in the market.
What are some common indicators used to identify a diamond top reversal pattern
Common indicators used to identify a diamond top reversal pattern include:
- Trendlines: Drawing trendlines around the pattern to form a diamond shape is crucial in identifying a diamond top. The price action should remain within these trendline boundaries14.
- Volume: Decreasing volume during the formation of the pattern is often observed. Increased trading volume accompanying a breakout below the lower trendline can provide added confirmation of the reversal4.
- Breakout Confirmation: Waiting for a clear breakout below the lower trendline of the diamond, accompanied by increased trading volume, is a key indicator of a potential reversal. This breakout serves as a confirmation of the reversal from an uptrend to a downtrend4.
- Price Oscillator: Using a price oscillator can help increase accuracy in identifying the diamond pattern. Monitoring the relative strength index, average convergence, and divergence can provide insights into price action movement and confirm breakout levels3.
- Confirmation Indicators: Traders may consider using additional technical indicators like moving averages, relative strength, or oscillators to confirm the bearish sentiment and strengthen their trading decisions when identifying a diamond top reversal pattern4.
These indicators play a crucial role in helping traders recognize and confirm the formation of a diamond top reversal pattern, enabling them to make informed trading decisions based on potential trend reversals.