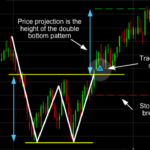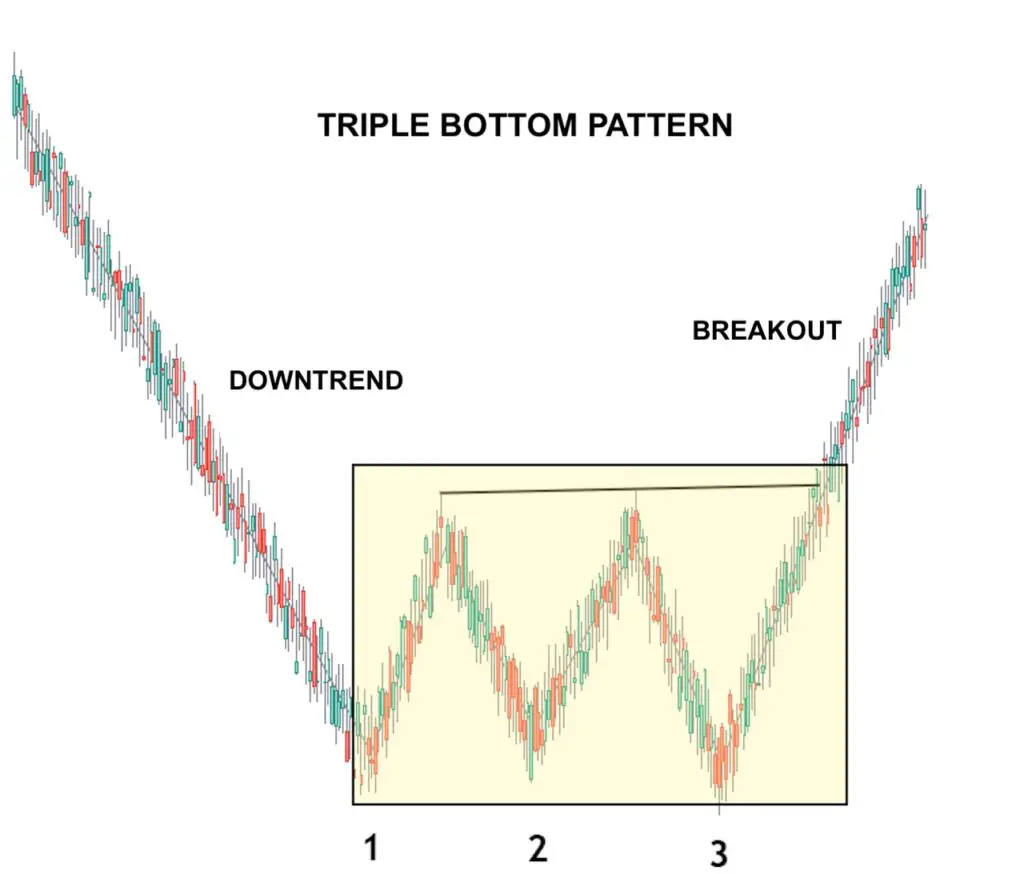
A triple bottom is a bullish chart pattern in technical analysis characterized by three equal lows followed by a breakout above resistance. This pattern typically occurs after a prolonged downtrend, signaling a potential trend reversal where buyers take control from sellers. The key features of a triple bottom include three roughly equal lows bouncing off support, decreasing volume during the pattern, and increasing bullish volume upon the breakout. Traders often set price targets based on the distance between the lows and the breakout point.
Stop-loss points are usually placed below the breakout point or the triple bottom lows to manage risk. The triple bottom is considered a bullish reversal pattern, indicating an upward trend after the third low, breaking resistance levels, and moving towards higher prices. It is essential to confirm this pattern with other technical indicators or chart patterns for more reliable trading decisions.
what is the difference between triple bottom and triple top
The main difference between a triple bottom and a triple top lies in their implications for price movements and trend reversals. A triple bottom is a bullish reversal pattern that occurs after a downtrend, characterized by three lows at approximately the same level followed by a breakout above resistance. This pattern signals a potential trend change to the upside, indicating that buyers are gaining control from sellers.
On the other hand, a triple top is a bearish reversal pattern that forms after an uptrend, consisting of three peaks at a similar level followed by a breakdown below support. A triple top suggests a shift in control from buyers to sellers, leading to a potential trend change to the downside. In essence, a triple bottom indicates a bullish reversal, while a triple top signifies a bearish reversal in price trends.
what are some common indicators used to identify triple top and triple bottom patterns
Common indicators used to identify triple top and triple bottom patterns include:
- Price Peaks and Troughs: Triple tops are characterized by three peaks of approximately equal height, while triple bottoms have three troughs of similar depth on a price chart.
- Trend Reversal: Triple tops indicate a potential trend reversal to the downside (bearish trend) after a strong uptrend, while triple bottoms suggest a potential trend reversal to the upside (bullish trend) following a downtrend.
- Resistance and Support Levels: In a triple top pattern, the resistance level is crucial as the price fails to break through it, signaling a potential downtrend. Conversely, in a triple bottom pattern, the support level prevents further decline, indicating a potential uptrend.
- Volume Analysis: Monitoring trading volume is essential for confirming the validity of triple top and triple bottom patterns. Strong volume accompanying the breakout or breakdown adds credibility to the pattern.
- Pattern Confirmation: Traders typically wait for the price to break below support in a triple top pattern or rise above resistance in a triple bottom pattern to confirm the completion of the pattern and anticipate further price movement in the indicated direction.
- Risk Management Strategies: Setting stop-loss orders above the neckline in a triple top pattern or below the neckline in a triple bottom pattern helps manage risk in trading these patterns effectively.
These indicators collectively help traders identify, confirm, and trade triple top and triple bottom patterns successfully by providing insights into potential trend reversals based on price action and market dynamics