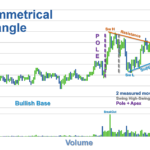
A bearish flag is a candlestick chart pattern that indicates the continuation of a downtrend after a temporary pause. This pattern consists of a flagpole, formed by a sharp decline in price, followed by a flag, which is a period of consolidation.
The bear flag signals the extension of a price decline. Traders identify this pattern by observing the price action consolidating within two parallel trend lines in the opposite direction of the downtrend. Once the supporting trend line is broken, the bear flag pattern is activated, leading to further downward movement in price.
how to identify a bearish flag pattern on a chart
To identify a bearish flag pattern on a chart, traders need to look for specific characteristics that define this continuation pattern. Here are the key steps to identify a bearish flag pattern:
- Sharp Decline (Flagpole): The pattern starts with a sharp decline, known as the flagpole, indicating a strong bearish trend34.
- Consolidation Phase (Flag): After the initial decline, there is a period of consolidation where prices move in a narrow range between two parallel lines. This consolidation is referred to as the flag component of the pattern34.
- Flag Breakout: Traders should wait for the price to break below the lower channel of the flag to confirm the bearish flag pattern. This breakout signals the continuation of the downtrend4.
- Fibonacci Retracement Levels: Pay attention to Fibonacci levels, particularly the 38.2% retracement level. Ideally, the retracement should be less than 38% for a textbook bearish flag pattern3.
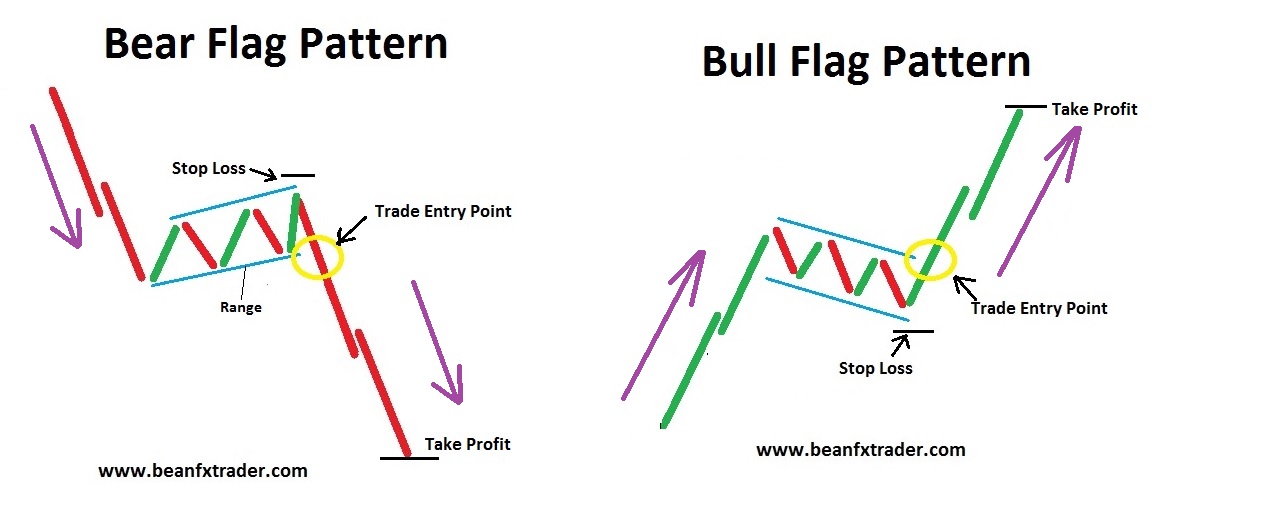
- Entry and Exit Points: Traders can enter the market either at the top of the flag for aggressive trading or wait for confirmation with a breakout below the flag for a more conservative approach. Protective stop-loss orders should be placed slightly above the flag to manage risk4.
By following these steps and understanding the structure of a bearish flag pattern, traders can effectively identify and trade this continuation pattern to capitalize on potential downward trends in the market.
what are some other technical analysis tools used by traders
Some other technical analysis tools commonly used by traders include:
- Moving Averages: Moving averages help smooth out price data to identify trends over specific time periods. Traders often use moving averages to confirm trends and potential reversal points2.
- Bollinger Bands: Bollinger Bands consist of a moving average and two standard deviations plotted above and below the moving average. They help traders identify overbought or oversold conditions and potential price breakouts2.
- Fibonacci Retracement: Fibonacci retracement levels are horizontal lines that indicate potential support and resistance levels based on the Fibonacci sequence. Traders use these levels to identify potential reversal points in the market2.
- Relative Strength Index (RSI): The RSI is a momentum oscillator that measures the speed and change of price movements. It helps traders identify overbought or oversold conditions in a security, indicating potential trend reversals2.
- MACD (Moving Average Convergence Divergence): The MACD is a trend-following momentum indicator that shows the relationship between two moving averages of a security’s price. Traders use the MACD to identify changes in the strength, direction, momentum, and duration of a trend2.
- Stochastic Oscillator: The stochastic oscillator is a momentum indicator that compares a security’s closing price to its price range over a specific period. It helps traders identify overbought or oversold conditions and potential trend reversals2.
These tools, along with the ones previously mentioned, form a comprehensive toolkit for traders to analyze market trends, identify potential entry and exit points, and make informed trading decisions based on technical analysis principles.