Saucer Reversal Patterns AKA rounding bottoms
Saucer reversal patterns, also known as rounding bottoms, are significant chart patterns used in technical analysis to signal potential reversals in a security’s price trend. These patterns typically indicate a transition from a downtrend to an uptrend. Here are key points regarding saucer reversal patterns based on the provided sources:
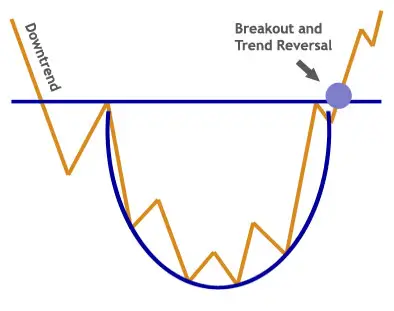
- Definition: A saucer, or rounding bottom, is a chart pattern that forms a “U” shape with a flat bottom, indicating a potential reversal in a security’s price trend15.
- Formation: Saucers usually occur at a security’s support levels after a downtrend, signifying a reversal in long-term price movements. They are characterized by a rounded, U-shaped pattern15.
- Identification: Traders look for specific elements to confirm a saucer pattern, including a prior downtrend, a low point followed by a consolidating phase, and a breakout above the neckline. Volume and price movement are crucial indicators in confirming the pattern15.
- Trading Signals: Saucers are typically expected to form at support trendlines, often after a selloff with high volume. Traders may buy the security at its lowest price to benefit from the anticipated uptrend following the saucer formation1.
- Inverse Saucer: Conversely, an inverse saucer, or rounded top, indicates that a stock’s price has reached its high and signals the end of an upward trend. This pattern reflects a shift from bullish to bearish sentiment among investors2.
In summary, saucer reversal patterns are essential tools for technical analysts to identify potential reversals in security prices, offering insights into market trends and potential trading opportunities.
how to identify a saucer pattern on a stock chart
To identify a saucer pattern on a stock chart, you need to look for specific characteristics that define this chart pattern. Here are the key steps based on the information from the provided sources:
- Shape and Structure: A saucer pattern, also known as a rounding bottom, appears as a U-shaped pattern on a stock chart with a flat bottom. It signifies a potential reversal from a downtrend to an uptrend25.
- Support Levels: Saucer patterns typically form at a security’s support levels, such as trendlines or channels, after an extended downtrend. This pattern indicates a transition from bearish to bullish sentiment among investors2.
- Price Movements: Look for a prior downtrend in the stock’s price, followed by a low point that starts a consolidating phase, changing momentum from bearish to bullish. The price should then reverse course and break out above the neckline of the saucer pattern2.
- Volume Confirmation: Volume is a crucial indicator when identifying a saucer pattern. Typically, volume should confirm the price action, with lower volume as the trough of the pattern is reached2.
- Handle Formation: In some cases, a saucer pattern may have a handle area, which is a secondary price decline before the stock moves to new highs. The handle should be at least one week long, drift downward, and form in the upper half of the entire base. The buy point is usually located above the highest price in the handle or the left-side high of the pattern plus a specific amount1.
- Duration and Depth: Saucer patterns can vary in length, ranging from several weeks to several months, and the depth of the pattern can be significant, often greater than 33% when stretched over a longer period5.
By following these guidelines and paying attention to the shape, support levels, price movements, volume, handle formation, and duration of the pattern, you can effectively identify a saucer pattern on a stock chart.