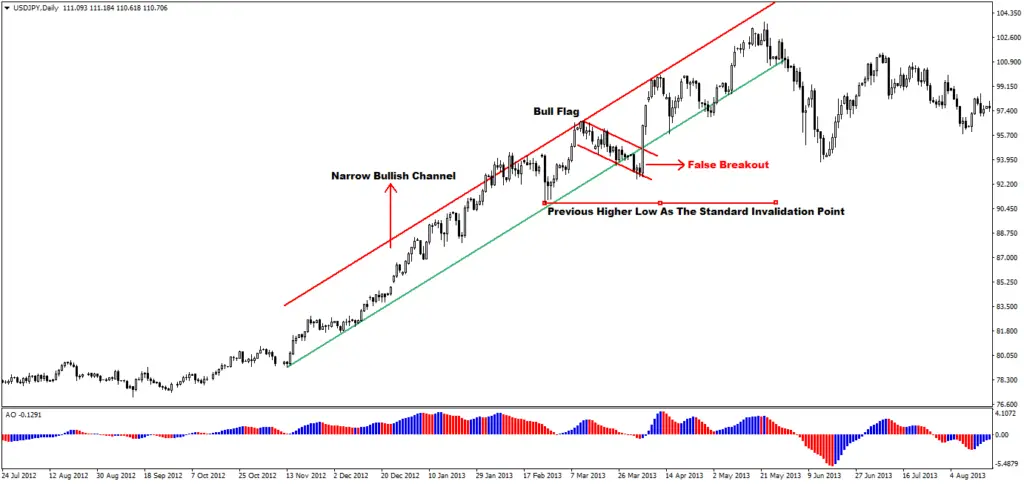
A bullish channel is a continuation chart pattern characterized by two parallel lines – the upper line known as the “resistance line” and the lower line as the “support line.” This pattern indicates a bullish trend where the price moves between these lines. Traders typically look to buy when the price touches the main trend line support and aim for a return to the lower boundary. It is advised to avoid opening short positions near the upper boundary of the channel in a bullish trend.
The bullish channel pattern is considered valid when the price touches the support line at least three times and the resistance line twice. Traders should be cautious of false breaks, with exits from bullish channels often occurring after the fourth contact with the support line. This pattern can be applied in various market conditions and is commonly used in technical analysis for trading decisions,
what are some other continuation patterns besides bullish channel
Other continuation patterns besides the bullish channel include:
- Ascending Triangle: This pattern is a consolidation pattern that signals a continuation of an uptrend. It is formed by two converging trendlines and typically leads to a breakout in the direction of the preceding trend2.
- Bullish Pennant: A bullish pennant is a continuation pattern that appears after a significant upward movement. It involves a brief consolidation period before the price continues moving in the direction of the trend2.
- Bullish Flag: The bullish flag pattern is characterized by a temporary pause in a strong upward move, followed by a continuation of the trend. It is identified by a downward sloping channel against the prevailing trend2.
- Bullish Rectangle Pattern: This pattern signifies a pause in the trend where the price moves sideways between parallel support and resistance lines before continuing in the original direction of the trend2.
- Descending Triangle: A consolidation pattern that indicates a continuation of a downtrend. It is formed by two converging trendlines and typically leads to a breakout in the direction of the preceding trend3.
- Bearish Pennant: Similar to the bullish pennant but in the opposite direction, the bearish pennant appears after a sharp downward movement and signals a continuation of the downtrend2.
- Bearish Flag: The bearish flag pattern is associated with a temporary pause in a strong downward move, followed by a continuation of the trend. It is identified by an upward sloping channel against the prevailing trend2.
- Bearish Rectangle Pattern: This pattern indicates a pause in the trend where the price moves sideways between parallel support and resistance lines before continuing in the original direction of the trend, but in a bearish context2.
These patterns are essential in technical analysis as they help traders identify potential entry and exit points based on the prevailing market trends.
what is a bearish channel and how is it different from a bullish channel
A bearish channel is a continuation chart pattern characterized by two parallel lines – the upper line known as the “resistance line” and the lower line as the “support line.” In a bearish channel, the price progresses between these two parallel lines, with the upper line acting as resistance and the lower line as support. The bearish channel pattern is considered valid when the price touches the support line at least three times and the resistance line twice. Traders typically focus on short positions when the price rebounds after hitting the resistance line in a bearish channel. It is advised to draw trend lines based on candlesticks’ high and low points to avoid false breaks, with exits from bearish channels often occurring after the fourth contact with the resistance line
24.On the other hand, a bullish channel is a continuation chart pattern where the price moves between two parallel lines – the upper “resistance line” and the lower “support line.” The key difference from a bearish channel is that in a bullish channel, the price progresses between these two lines with the upper line acting as resistance and the lower line as support. Traders typically look for long positions after a bounce from the support line in a bullish channel. Similar to the bearish channel, it is recommended to draw trend lines based on candlesticks’ high and low points to avoid false breaks, with exits from bullish channels often occurring after the fourth contact with the support line15.In summary, the primary distinction between a bearish channel and a bullish channel lies in the direction of the trend they represent. A bearish channel indicates a downward trend where the price moves between parallel lines, while a bullish channel signifies an upward trend where the price progresses between two parallel lines.