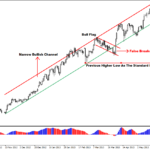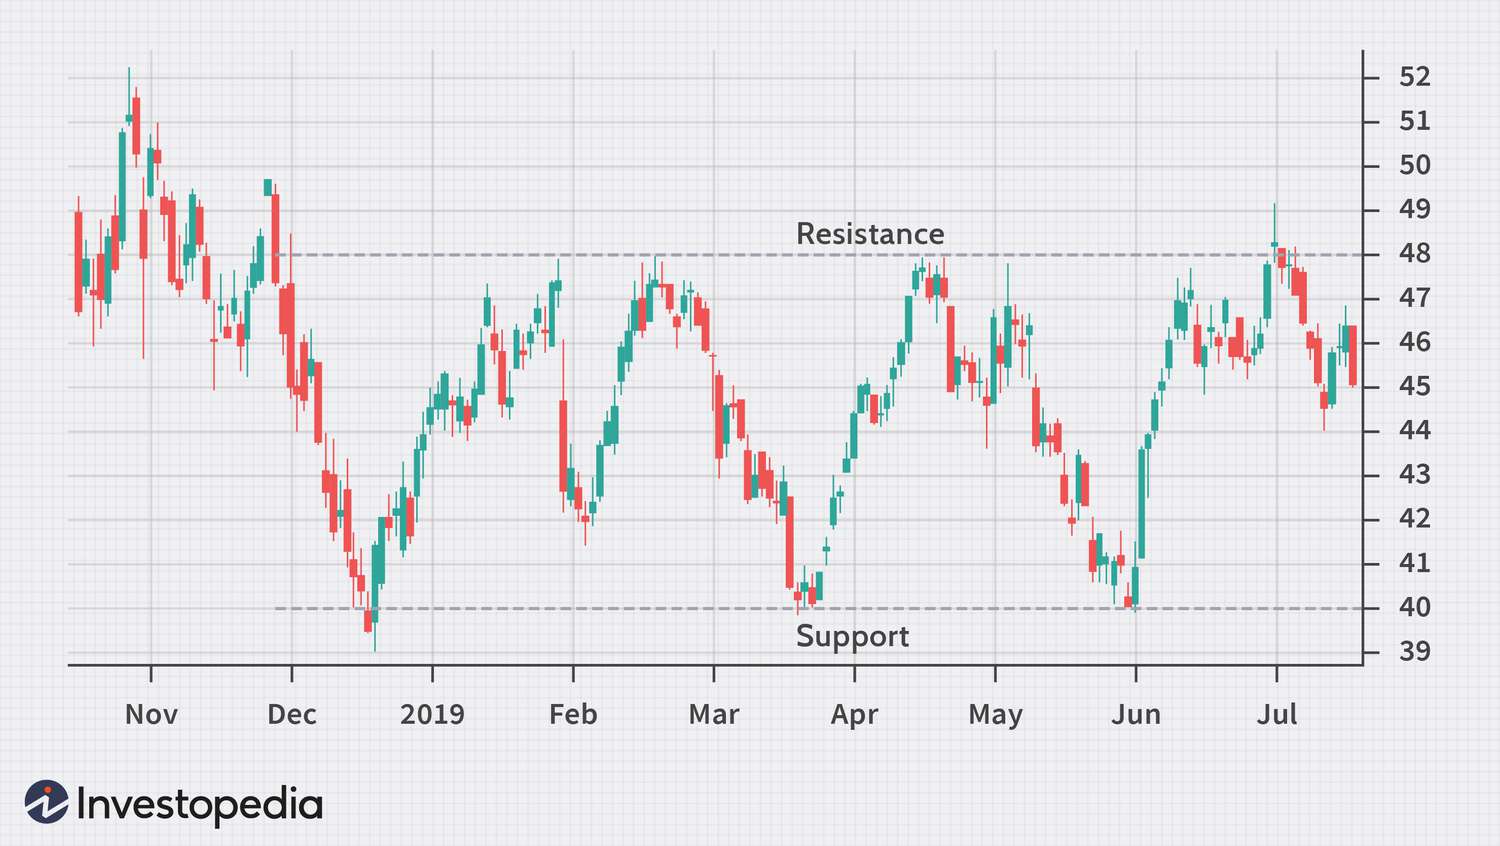
A horizontal channel is a neutral chart pattern that signifies investor indecision, where buyers and sellers are in a state of equilibrium until a breakout occurs, indicating a clear direction. This pattern consists of two parallel horizontal lines known as the “resistance line” and the “support line,” framing the price evolution.
The horizontal channel is confirmed when there is good oscillation between these lines, with each line being touched at least twice to validate the pattern12. Traders typically await an exit from the horizontal channel to determine the next movement’s direction, with a bullish exit indicating more buyers than sellers and a bearish exit indicating the opposite.
The longer the horizontal channel persists, the stronger the subsequent movement is expected to be, often accompanied by a price pullback after the exit1.
Use horizontal channel to make trading decisions
Traders can use horizontal channels as a valuable tool for making trading decisions by providing clear entry and exit points within a price range. Horizontal channels, also known as sideways trends, are formed by connecting variable pivot highs and lows, indicating a period of price consolidation and market indecision
Here’s how traders can utilize horizontal channels for trading decisions:
- Identifying Entry and Exit Points:
- Entry Points: Traders can enter long positions when the price hits the bottom of the channel and short positions when it reaches the top of the channel24.
- Exit Points: Exiting long positions at the top of the channel and short positions at the bottom can help traders secure profits or limit losses15.
- Breakout Trading:
- Using Pending Orders:
- Traders can strategically place pending orders above the resistance level and below the support level to automatically trigger trades when the price breaks out of the channel2.
- Break and Retest Strategy:
- This strategy involves trading the retest of a breakout level, where traders can set buy-limits at previous resistance levels or sell-limits at previous support levels2.
- Incorporating Candlestick Signals:
- Combining candlestick patterns at support and resistance levels within a horizontal channel can enhance the predictive value of trading decisions4.
By following these strategies and rules within a horizontal channel, traders can effectively navigate market indecision, identify potential trends, and make informed trading decisions based on price action and technical analysis indicators.
what are the key characteristics of a horizontal channel
The key characteristics of a horizontal channel include:
- Formation:
- Price Movement:
- Equal Buying and Selling Pressure:
- Breakout Signals:
- Trading Opportunities:
- Visual Representation:
- Technical Analysis Tools:
- Traders can use technical analysis indicators like trend lines, moving averages, or Fibonacci retracement levels to create and analyze horizontal channels, enhancing their trading decisions5.
By understanding these key characteristics, traders can effectively leverage horizontal channels to make informed trading decisions, identify potential breakouts, and navigate market trends during periods of price consolidation.