Broadening top reversal patterns are technical chart patterns characterized by widening ranges where prices alternate between higher highs and lower lows. These patterns are often seen as a signal of a potential shift in the prevailing trend, with bearish implications. The formation typically occurs after a significant rise in prices and is identified by two diverging trend lines, one rising and one falling. Traders use broadening top patterns to anticipate potential reversals in the market. Key points about Broadening Top Reversal Patterns:
- Formation: Broadening tops reflect growing investor nervousness and indecision, leading to larger price oscillations between the two trend lines.
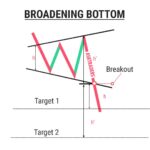
- Confirmation: The pattern is considered complete when the price breaks below the lower trendline for a bearish reversal or above the upper trendline for a bullish reversal.
- Trading Strategies: Traders can enter long positions at the break of resistance from the 5th or 6th rotation, with stop-loss placed under the resistance. Alternatively, short positions can be taken at the break of resistance from the 5th or 6th rotation, with stop-loss placed above the support.
- Statistics: Broadening tops have a bullish exit in 53% of cases, with 75% achieving their pattern objective using specific techniques.
- Market Context: Traders should consider broader market indicators, volume analysis, and risk management strategies when trading broadening top patterns.
These patterns are valuable tools for traders looking to identify potential reversals in the market and adjust their trading strategies accordingly based on technical analysis and market conditions
what are some common indicators used to identify broadening top patterns
Common indicators used to identify broadening top patterns include:
- Relative Strength Index (RSI): Helps identify overbought and oversold levels, indicating potential reversal points within the pattern.
- Stochastic Oscillator: Another indicator for identifying overbought or oversold conditions, aiding in predicting potential reversals.
- Bollinger Bands: Useful for determining volatility and potential price breakouts within the broadening top pattern.
- Volume Indicators: Analyzing trading volume can confirm the authenticity of the pattern, especially when volume increases near the top of the pattern.
- Support and Resistance Levels: Important historical or projected levels can provide significant insights into potential price movements within the pattern.
- Fibonacci Retracements: Used to identify potential support or resistance levels based on the Fibonacci sequence, aiding in predicting price reversals.
These indicators, when used in conjunction with the visual characteristics of the broadening top pattern, can enhance traders’ ability to identify and interpret potential reversals accurately
how can traders use broadening top patterns to identify potential reversals
Traders can use broadening top patterns to identify potential reversals by recognizing the distinctive characteristics of this pattern and implementing specific trading strategies. Broadening top patterns are bearish reversal patterns that signal a potential shift in the prevailing trend. Here’s how traders can utilize these patterns effectively:
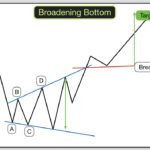
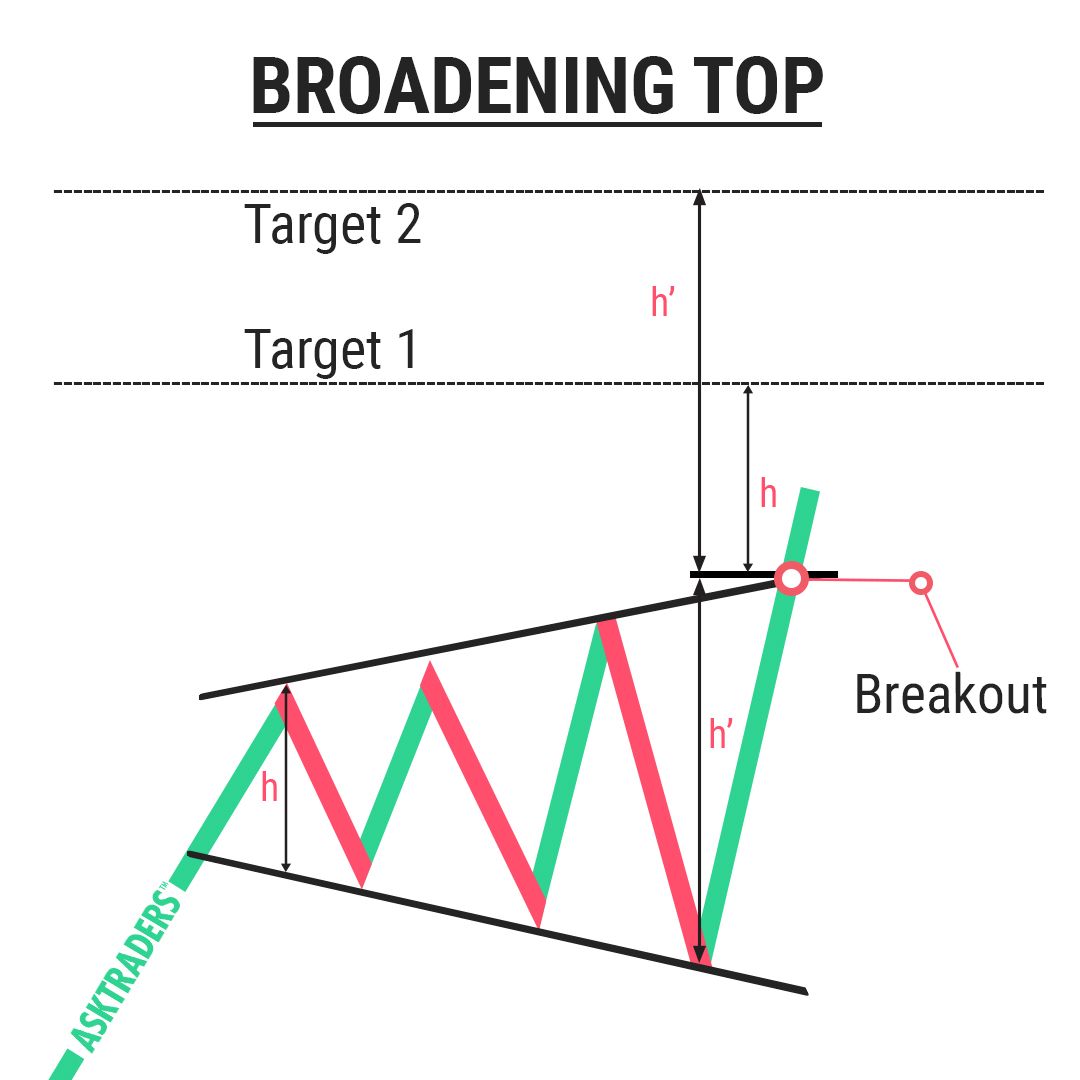
- Pattern Recognition: Traders should look for the widening range where prices alternate between higher highs and lower lows, creating a megaphone-like shape on the chart. This pattern typically occurs after a prolonged uptrend and indicates increased volatility and market uncertainty.
- Breakout Confirmation: Traders can wait for a breakout confirmation above the upper trendline for a bearish reversal or below the lower trendline for a bullish reversal. This breakout signals a potential shift in market sentiment and provides a clear entry signal.
- Trading Strategies:
- Breakout Strategy: Traders can enter a trade after a confirmed breakout above the upper trendline for a bearish reversal or below the lower trendline for a bullish reversal. This strategy involves anticipating a continuation of the prevailing trend based on the breakout.
- Reversal Strategy: Another approach is to look for specific reversal patterns within the broadening top formation, such as double tops or double bottoms, to identify potential entry points. Traders can anticipate a reversal in the prevailing trend based on these patterns.
- Range Trading Strategy: Traders can also take advantage of price oscillations between the upper and lower trendlines by buying near the lower trendline and selling near the upper trendline. This strategy is suitable for traders looking to profit from short-term price movements within the pattern.
- Risk Management: It is crucial for traders to manage risks effectively by placing stop-loss orders to mitigate potential losses if the pattern does not unfold as expected. Additionally, traders should consider using other technical indicators and analysis tools to confirm the pattern before making trading decisions.
By understanding the characteristics of broadening top patterns, confirming breakouts, implementing appropriate trading strategies, and managing risks effectively, traders can leverage these patterns to identify potential reversals in the market and make informed trading decisions