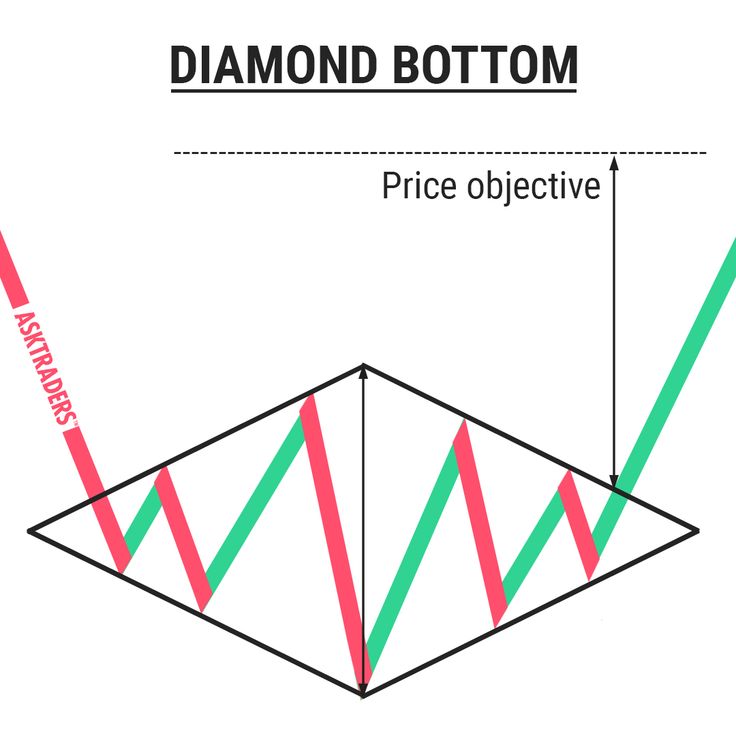
A diamond bottom is a bullish reversal chart pattern characterized by two juxtaposed symmetrical triangles forming a diamond shape. This pattern typically emerges after a bearish trend, signaling the exhaustion of selling pressure and investor indecision.
The volatility and oscillations increase in the first half of the pattern and decrease in the second half. The price objective of a diamond bottom is calculated by measuring the maximum height of the diamond at the breakout point. Diamond bottoms have a bullish output in 82% of cases, with a price objective reached in 79% of instances. This pattern is considered a strong bullish reversal signal among technical analysts.
what are some common indicators used to identify diamond bottom patterns
Some common indicators used to identify diamond bottom patterns include:
- Volume: A significant increase in volume during the formation of a diamond bottom pattern is a key indicator to watch for. Volume can provide insights into the strength of the pattern and potential price reversals1.
- Neckline: The neckline in a diamond pattern plays a crucial role in confirming the pattern. It is the price level that connects the swing low points and acts as a support line during the pattern formation. A breakout above the neckline confirms the pattern and suggests a potential bullish reversal2.
- Candles and Candlesticks: Candles and candlestick patterns are essential components in identifying diamond bottom patterns. The size and shape of candles can provide clues about the strength of the trend and potential reversal points. Traders often look for specific candlestick patterns like dojis or pin bars that signal indecision and potential reversals4.
- Trading Volumes: Trading volumes are significant in diamond patterns. Volumes often increase as the pattern develops and reach their peak at the broadest part of the pattern. A subsequent decline in volumes, followed by a sharp increase at the breakout, can confirm the validity of the diamond pattern4.
- Technical Indicators: Traders can incorporate technical indicators like moving averages, MACD, or RSI to confirm the pattern and the subsequent trend reversal. These indicators can provide additional confirmation of the pattern and help traders make informed decisions24.
These indicators are commonly used by traders to identify and confirm diamond bottom patterns, aiding in making informed trading decisions based on technical analysis principles.
what is the difference between a diamond top and a diamond bottom pattern
Common indicators used to identify a diamond top reversal pattern include:
- Trendlines: Drawing trendlines around the pattern to form a diamond shape is crucial in identifying a diamond top. The price action should remain within these trendline boundaries14.
- Volume: Decreasing volume during the formation of the pattern is often observed. Increased trading volume accompanying a breakout below the lower trendline can provide added confirmation of the reversal4.
- Breakout Confirmation: Waiting for a clear breakout below the lower trendline of the diamond, accompanied by increased trading volume, is a key indicator of a potential reversal. This breakout serves as a confirmation of the reversal from an uptrend to a downtrend4.
- Price Oscillator: Using a price oscillator can help increase accuracy in identifying the diamond pattern. Monitoring the relative strength index, average convergence, and divergence can provide insights into price action movement and confirm breakout levels3.
- Confirmation Indicators: Traders may consider using additional technical indicators like moving averages, relative strength, or oscillators to confirm the bearish sentiment and strengthen their trading decisions when identifying a diamond top reversal pattern4.
These indicators play a crucial role in helping traders recognize and confirm the formation of a diamond top reversal pattern, enabling them to make informed trading decisions based on potential trend reversals.