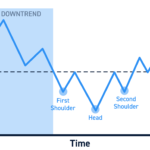
The inverse head and shoulders pattern is a bullish chart formation used in trading to signal a potential reversal of a downtrend. It consists of three troughs: two higher “shoulders” and a lower “head”. This pattern indicates a shift from a bearish to a bullish trend when the price breaks above the “neckline”
Traders often enter positions at this breakout point, set stop loss orders below the right shoulder, and use technical analysis indicators like moving averages, Relative Strength Index (RSI), and Moving Average Convergence Divergence (MACD) for confirmation1. The psychology behind this pattern involves a transition from pessimism to optimism as the sentiment shifts from bearish to bullish, culminating in a breakout above the neckline1.The inverse head and shoulders pattern is validated when the price breaks above the neckline, with a price objective equal to the height between the neckline and the head, projected above the neckline2.
Statistics show that in 98% of cases, the exit from this pattern is bullish, with a high likelihood of reaching the pattern’s objective2. The longer the movement before the pattern’s formation, the stronger the bullish movement upon breakout2. Traders should adhere to specific entry and risk management criteria for successful trading, ensuring that the pattern includes two “shoulders” and a “head”, climactic price action, and a breakout from the neckline4.In summary, the inverse head and shoulders pattern is a reliable indicator of a potential bullish reversal in trading, with specific rules for identification, confirmation, and trading strategies to capitalize on this pattern effectively.
what are the key characteristics of an inverse head and shoulders pattern
The key characteristics of an inverse head and shoulders pattern are as follows:
- Formation: The pattern consists of three troughs – two higher “shoulders” and a lower “head.” It is formed after a downtrend, with the middle trough (head) being the deepest and the two outside troughs (shoulders) being shallower2.
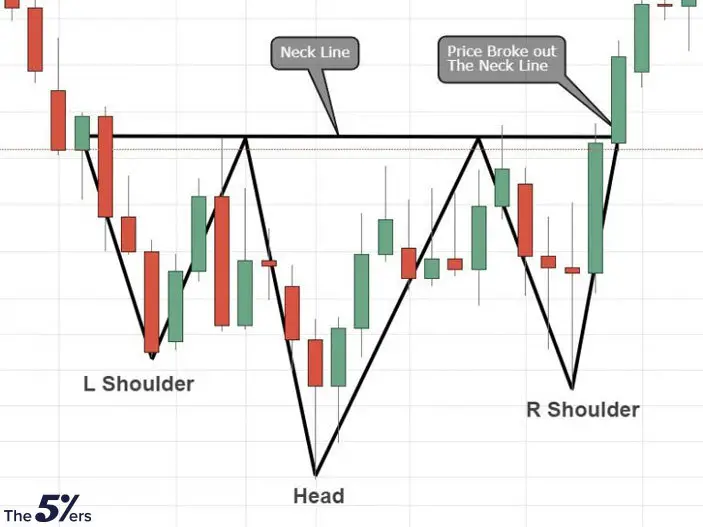
- Neckline: A resistance level, known as the neckline, is created by connecting the reaction highs in the middle of the pattern. The price action that forms the inverse head and shoulders pattern is essentially the reverse of the regular head and shoulders pattern, but with a focus on volume patterns for confirmation2.
- Breakout: The pattern is validated when the price breaks above the neckline, signaling a potential trend reversal. This breakout indicates that the bulls have taken control of the market, leading to a shift from a bearish to a bullish trend14.
- Volume: Volume plays a significant role in confirming the pattern, especially in bottom formations. An increase in volume on the neckline breakout is crucial for confirming the pattern2.
- Price Objective: The price objective of the pattern is equal to the height between the neckline and the head, projected above the neckline. Statistics show that in 98% of cases, the exit from this pattern is bullish, with a high likelihood of reaching the pattern’s objective3.
- Performance Factors: Factors affecting the pattern’s performance include the symmetry of the shoulders, the length of the movement before the pattern’s formation, the abruptness of the movement prior to the pattern, and the direction of the neckline (upward, downward, or horizontal)3.
In summary, the inverse head and shoulders pattern is a reliable bullish reversal indicator characterized by specific trough formations, a breakout above the neckline, volume confirmation, and a projected price objective above the neckline. Understanding these key characteristics is essential for effectively identifying and trading this pattern in the financial markets.
what are some examples of stocks that have exhibited an inverse head and shoulders pattern
Some examples of stocks that have exhibited an inverse head and shoulders pattern include:
- Alaska Air Group, Inc. (ALK): This stock formed a Head and Shoulders Bottom with a downward sloping neckline. The pattern marked a major trend reversal after a downtrend2.
- AT&T (T): Another example is AT&T, which formed a head and shoulders bottom with a flat neckline. While the shoulders were slightly shallow, the neckline and head were well pronounced, indicating a reversal pattern after a downtrend2.
- WTI stock: WTI stock exhibited an inverse head and shoulder pattern, showing a bullish technical chart situation. The stock price broke the neckline, signaling a buying opportunity and a reversal from a downtrend3.
- TATA consumer products: TATA consumer products reached a 52-week high after forming an inverse head and shoulders pattern. The stock indicated a bullish run, breaking the neckline and showing a potential uptrend after a period of decline3.
These examples demonstrate how stocks can exhibit the inverse head and shoulders pattern as a reliable indicator of potential trend reversals from downtrends to uptrends in the financial markets.