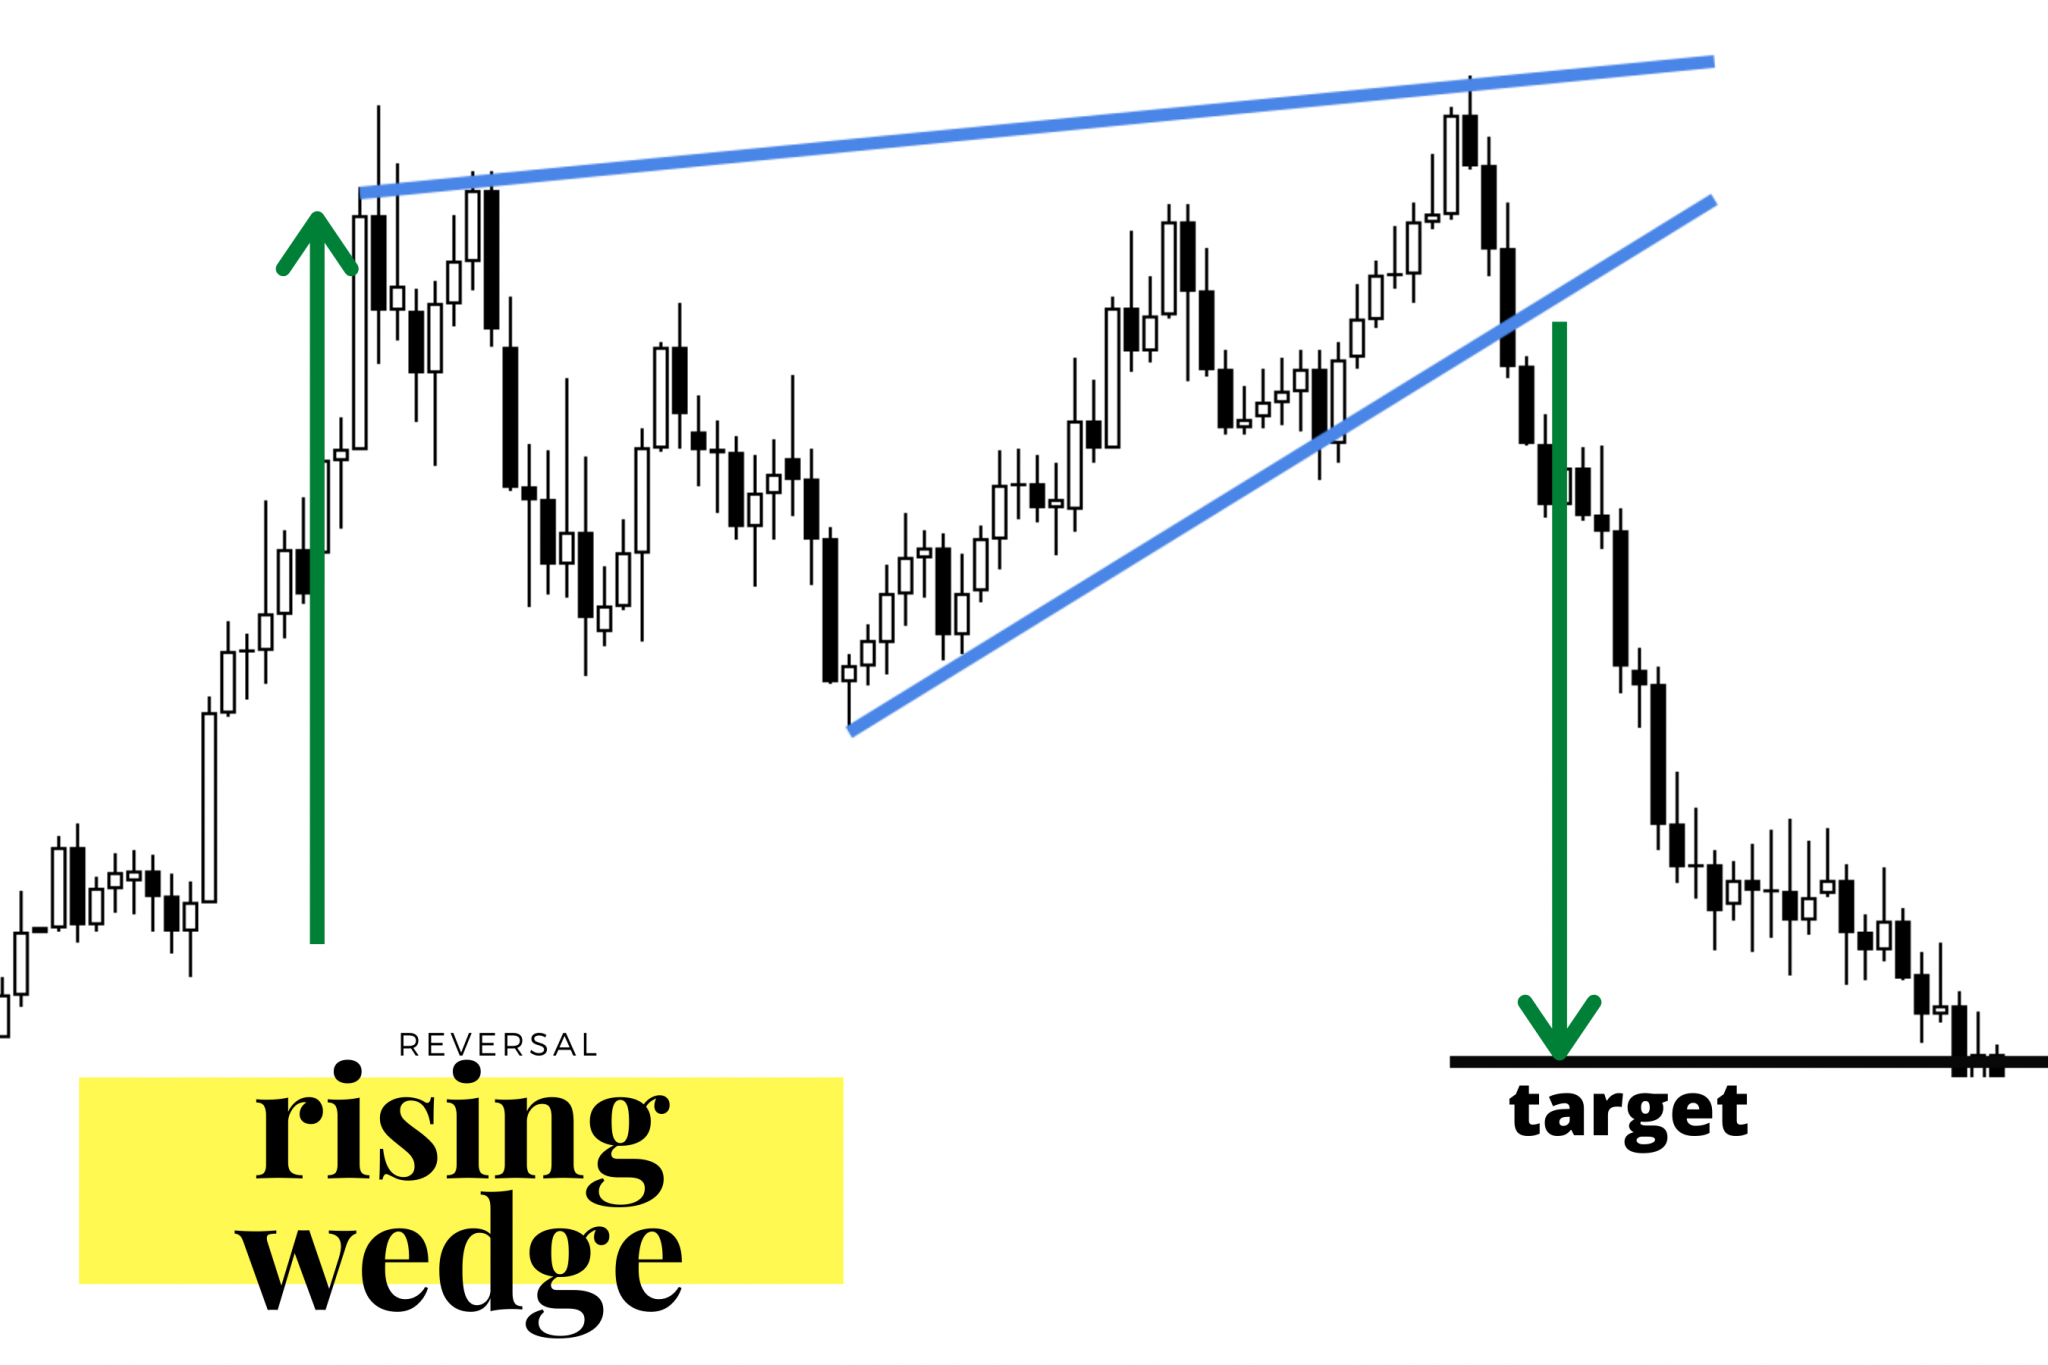
A rising wedge is a bearish chart pattern that can act as both a continuation and reversal pattern. In this pattern, the price consolidates between upward sloping support and resistance lines, with the support line steeper than the resistance line. This leads to a wedge-like formation where higher lows are being formed faster than higher highs.
A rising wedge can signal a bearish reversal if it forms after an uptrend or a continuation of the downtrend if it forms during a downtrend123. The breakout from a rising wedge typically occurs to the downside, indicating that lower prices are likely as the forces of supply overcome demand4.
what is the difference between a rising wedge and a falling wedge
The main difference between a rising wedge and a falling wedge lies in their implications and the market conditions in which they typically occur.
- Rising Wedge:
- Implication: A rising wedge is a bearish chart pattern that often signals a bearish reversal. It forms after an uptrend and indicates a potential trend reversal to the downside.
- Market Condition: Rising wedges are characterized by converging trend lines where the upper trend line is steeper than the lower one. They suggest weakening demand as prices continue to rise, leading to a breakout to the downside123.
- Falling Wedge:
- Implication: A falling wedge is a bullish chart pattern that usually signals a bullish reversal. It forms after a downtrend and indicates a potential trend reversal to the upside.
- Market Condition: Falling wedges are characterized by converging trend lines where the lower trend line is steeper than the upper one. They suggest a downtrend losing momentum as buyers enter the market, leading to a breakout to the upside235.
In summary, a rising wedge is typically bearish and signals a potential reversal to the downside after an uptrend, while a falling wedge is usually bullish and signals a potential reversal to the upside after a downtrend.
what are some common indicators used to confirm a falling wedge pattern
Some common indicators used to confirm a falling wedge pattern include:
- Volume Indicator: Traders can look to the volume indicator to see higher volume, indicating greater conviction in the move up when the price breaks above the upper trendline of the falling wedge pattern34.
- Moving Average Overlays: Moving averages can be used in conjunction with falling wedge patterns to confirm price trends and potential breakouts.
- Average True Range (ATR): ATR can help traders gauge the volatility of the asset, providing insights into potential price movements within the falling wedge pattern.
- Bollinger Bands: Bollinger Bands can be used to identify potential breakouts and volatility within the falling wedge pattern.
- Relative Strength Index (RSI): RSI can help traders determine overbought or oversold conditions within the falling wedge pattern, indicating potential reversal points.
- Moving Average Convergence Divergence (MACD): MACD can provide signals of trend strength and potential crossovers within the falling wedge pattern.
- Parabolic SAR: While less popular, the Parabolic SAR can be used to provide potential entry and exit points within the falling wedge pattern4.
These indicators, when used in conjunction with the visual cues of the falling wedge pattern, can help traders confirm potential buying opportunities and manage risk effectively.


